

Question: The Kyoto Protocol was signed in 1997, and required countries to start reducing their carbon emissions. The Do is unknown protocol became enforceable in February
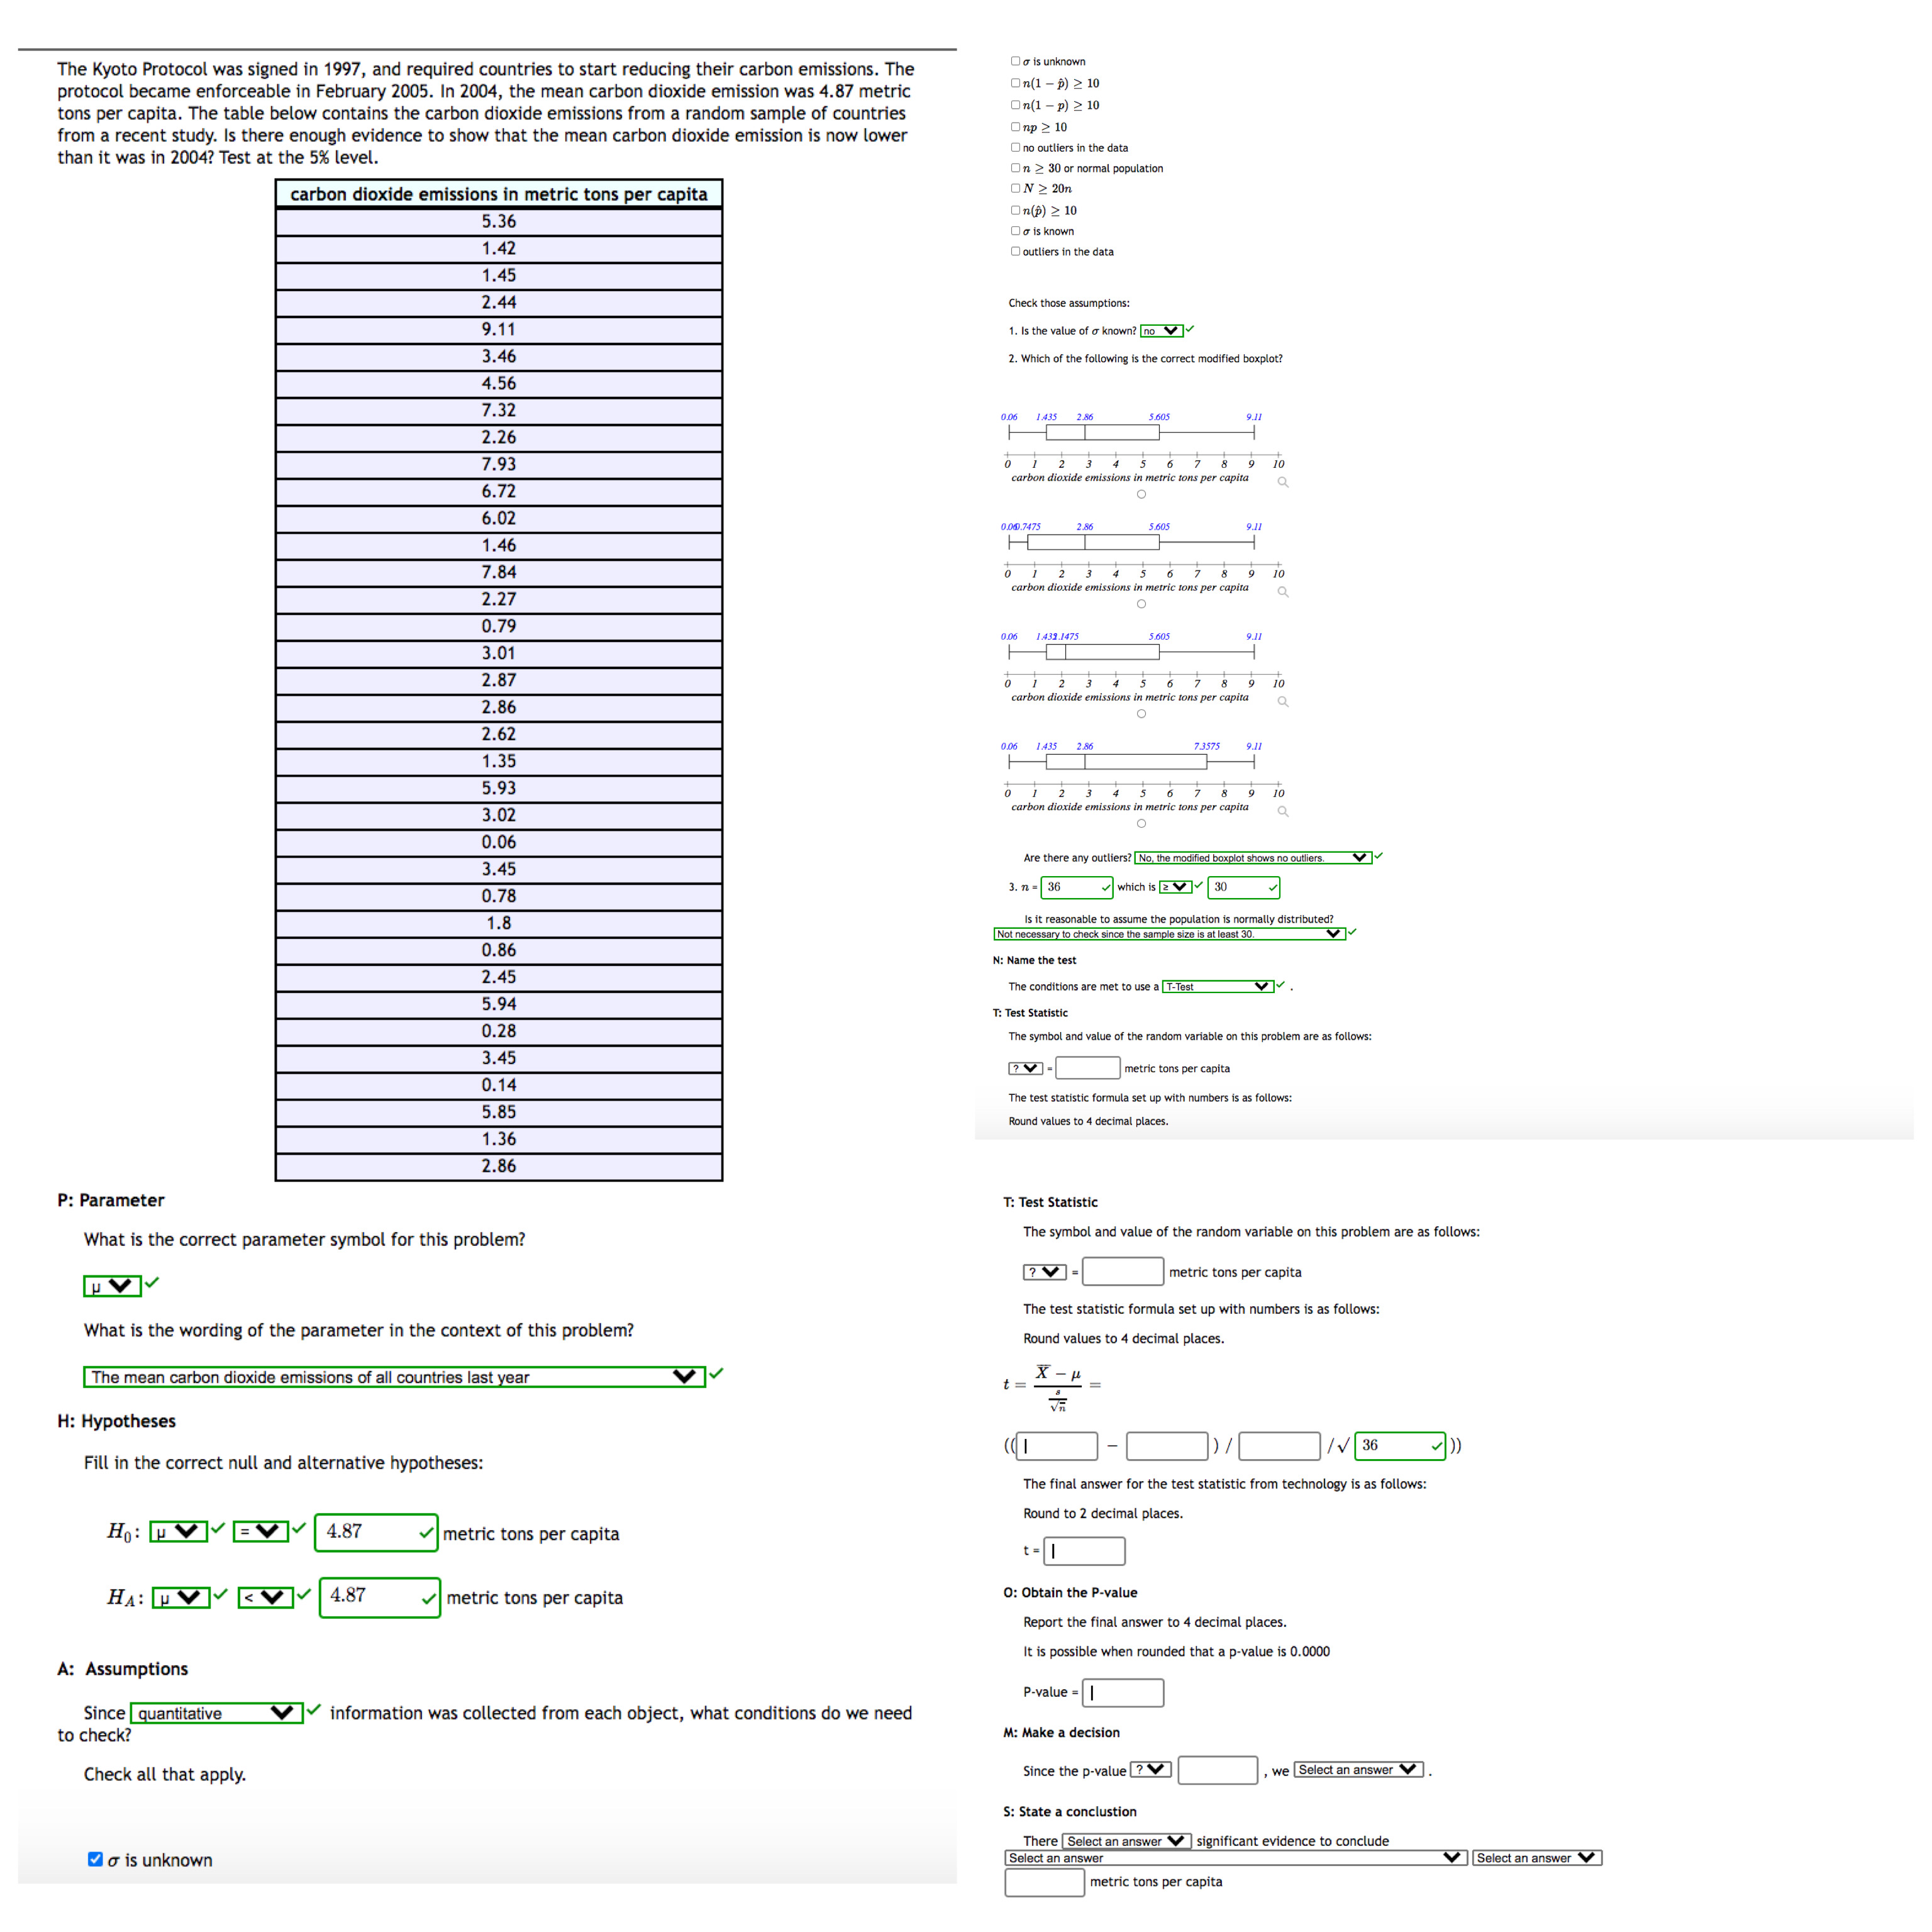

The Kyoto Protocol was signed in 1997, and required countries to start reducing their carbon emissions. The Do is unknown protocol became enforceable in February 2005. In 2004, the mean carbon dioxide emission was 4.87 metric On(1 - ) 2 10 capita, The table below contains the carbon dioxide emissions from a random sample of In(1 - p) 2 10 from a recent study. Is there enough evidence to show that the mean carbon dioxide emission is now lower Inp 2 10 than it was in 2004? Test at the 5% level. no outliers in the data On 2 30 or normal population carbon dioxide emissions in metric tons per capita ON 2 20n 5.36 On(p) 2 10 1.42 Do is known outliers in the data 1.45 2.44 Check those assumptions: 9.11 1. Is the value of o known? [no 3.46 2. Which of the following is the correct modified boxplot? 4.56 7.32 2.26 7.93 6.72 carbon dioxide emissions in metric tons per capita? 10 6.02 1.46 sBos 7.84 2.27 carbon dioxide emissions in metric tons per capita? 10 0.79 3. 01 2. 87 2 .86 carbon dioxide emissions in metric tons per capita ? 10 2 . 62 1.35 0 06 1435 285 73575 5 .93 3.02 carbon dioxide emissions in metric tons per capita ? 10 0 .06 3 .45 Are there any outliers ? No , the modified boxplot shows no outliers . 0.78 16 which is 2 v 30 1 .8 0 .86 Not necessary to check since the sample size is at least 30 . 2.45 V: Name the test 5.94 The conditions are met to use a T-Test . 0 .28 T: Test Statistic 3.45 The symbol and value of the random variable on this problem are as follows: 0.14 metric tons per capita 5 .85 The test statistic formula set up with numbers is as follows: 1.36 ound values to 4 decimal places . 2 86 P: Parameter T: Test Statistic What is the correct parameter symbol for this problem? The symbol and value of the random variable on this problem are as follows: ? V = metric tons per capita What is the wording of the parameter in the context of this problem? The test statistic formula set up with numbers is as follows: Round values to 4 decimal places The mean carbon dioxide emissions of all countries last year A - H H: Hypotheses Fill in the correct null and alternative hypotheses: / 36 1) The final answer for the test statistic from technology is as follows: Ho : V EV 4.87 |metric tons per capita Round to 2 decimal places. =I HA : WVV VV 4.87 |metric tons per capita O: Obtain the P-value Report the final answer to 4 decimal places. A: Assumptions It is possible when rounded that a p-value is 0.0000 Since quantitative P-value = 1 Vy information was collected from each object, what conditions do we need to check? M: Make a decision Check all that apply. Since the p-value ? J. we [Select an answer . : State a conclustion o is unknown There Select an answer V significant evidence to conclude Select an answer V Select an answer metric tons per capita
Step by Step Solution
There are 3 Steps involved in it

Get step-by-step solutions from verified subject matter experts