

Question: The last image is an EXAMPLE only, pls do it like this. TQ. 2.13 26 2.12 26 2.16 27 2.04 28 1.70 28 2.11 29
The last image is an EXAMPLE only, pls do it like this. TQ.
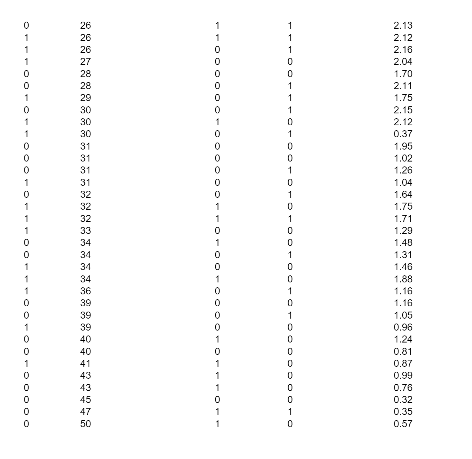
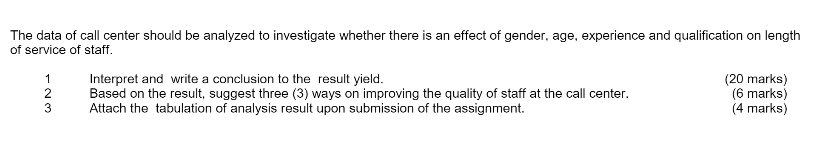
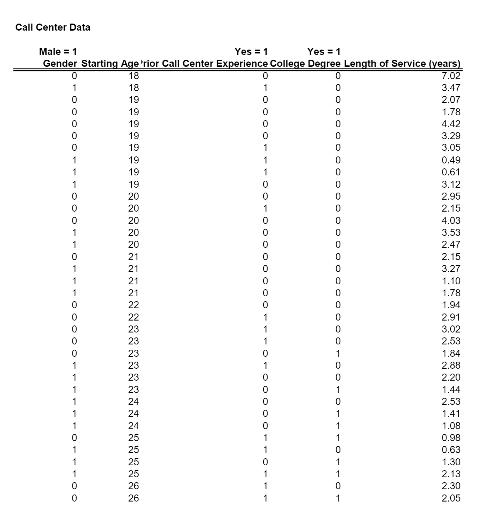
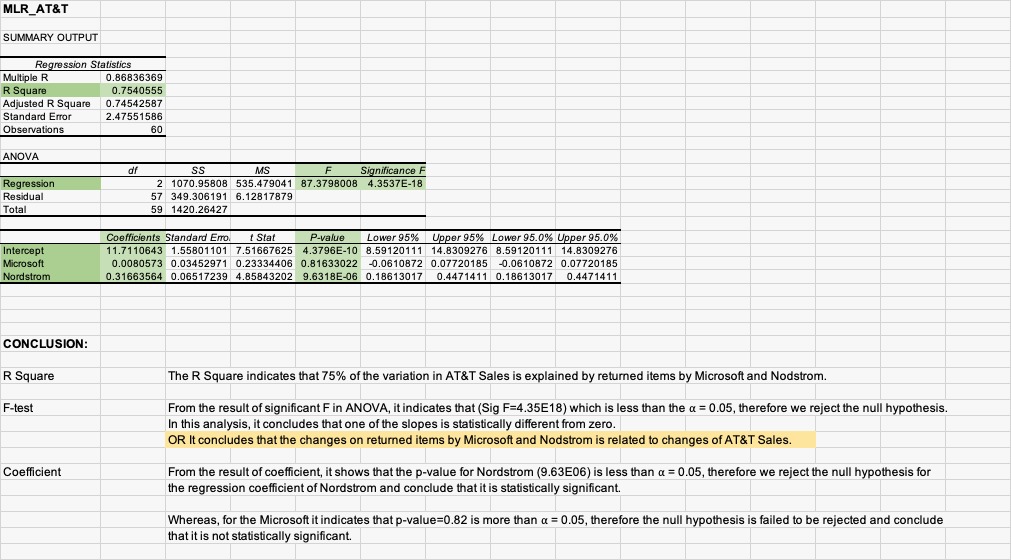
2.13 26 2.12 26 2.16 27 2.04 28 1.70 28 2.11 29 1.75 30 2.15 . O 30 2.12 30 0.37 1.95 31 1,02 O 31 1.26 31 1.04 1.64 1.75 1.71 -404-20-0060-00-0--060000-609090- - 1.20 34 1.40 34 1.31 34 1.40 34 1.88 36 1.16 39 1.16 39 1.05 39 0.96 40 1.24 40 0.81 0.87 43 0.99 0 0 0 0 0- 0 0.76 D.32 0.35 50 0.57The elata of call center should be analyzed to investigate whether there is an effect of gender. age. experience and qualification on length ef service of staff. 1 Interpret and write a conclusion to the result yield. {20 merits]: 2 Based on the result. suggest three {3} ways on improving the quality of staff at the call center. [E5 marks} 3 Attach the tabulation of analysis result upon submission of the assignment. [4 marks} Call Center Data Male = 1 Yes = 1 Yes = 1 Gender Starting Age 'rior Call Center Experience College Degree Length of Service (years) 18 18 7.02 19 3.47 19 2.07 19 1.78 19 4.42 19 3.29 19 3.05 0.49 0.61 3.12 2.95 2.15 4.03 3.53 2.47 2.15 3.27 0604000906406090-649090 0 1.10 1.78 1.94 2.91 3.02 2.53 1.84 2.85 2.20 1.44 2.53 1.41 1.08 0.98 0.63 1.30 2.13 2.30 2.05MLR_AT&T SUMMARY OUTPUT Regression Statistics Multiple R 0.86836369 R Square 0.7540555 Adjusted R Square 0.74542587 Standard Error 2.47551586 Observations 60 ANOVA of SS MS F Significance F Regression 2 1070.95808 535.479041 87.3798008 4.3537E-18 Residual 57 349.306191 6.12817879 Total 59 1420.26427 Coefficients Standard Eno. 1 Stat P-value Lower 95% Upper 95% Lower 95.0% Upper 95.0% Intercept 11.7110643 1.55801101 7.51667625 4.3796E-10 8.59120111 14.8309276 8.59120111 14.8309276 Microsoft 0.0080573 0.03452971 0.23334406 0.81633022 -0.0610872 0.07720185 -0.0610872 0.07720185 Nordstrom 0.31663564 0.06517239 4.85843202 9.6318E-06 0.18613017 0.4471411 0.18613017 0.4471411 CONCLUSION: R Square The R Square indicates that 75% of the variation in AT&T Sales is explained by returned items by Microsoft and Nodstrom. F-test From the result of significant F in ANOVA, it indicates that (Sig F=4.35E18) which is less than the a = 0.05, therefore we reject the null hypothesis. In this analysis, it concludes that one of the slopes is statistically different from zero. OR It concludes that the changes on returned items by Microsoft and Nodstrom is related to changes of AT&T Sales. Coefficient From the result of coefficient, it shows that the p-value for Nordstrom (9.63E06) is less than a = 0.05, therefore we reject the null hypothesis for the regression coefficient of Nordstrom and conclude that it is statistically significant. Whereas, for the Microsoft it indicates that p-value=0.82 is more than a = 0.05, therefore the null hypothesis is failed to be rejected and conclude that it is not statistically significant
Step by Step Solution
There are 3 Steps involved in it

Get step-by-step solutions from verified subject matter experts