

Question: The last two lines print 0.9 and 0.91 R code for this problem: Using a for loop, simulate 10,000 simple random samples of size n
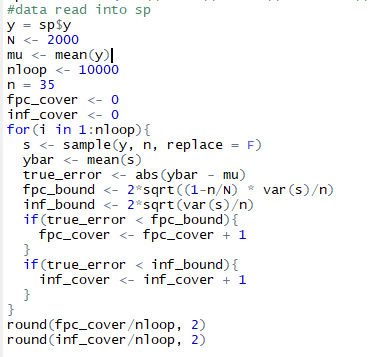
The last two lines print 0.9 and 0.91
R code for this problem:
Using a for loop, simulate 10,000 simple random samples of size n = 35. for each sample, calculate the sample mean and 95% bound, then determine the proportion of times that the population mean is within the 95% confidence interval (ybar - B, ybar + B). Do these bounds capture the true population mean about 95% of the time as claimed?
If the coverage probability is approximately 95%, explain why. if it is different from 95%, explain why (hint: examine sampling distribution of ybar)
#data read into sp yspsy N
Step by Step Solution
There are 3 Steps involved in it
1 Expert Approved Answer
Step: 1 Unlock

Question Has Been Solved by an Expert!
Get step-by-step solutions from verified subject matter experts
Step: 2 Unlock
Step: 3 Unlock