

Question 3: Analysis of marital status [25 marks] We look at data from an SRS of...
Fantastic news! We've Found the answer you've been seeking!
![Question 3: Analysis of marital status [25 marks] We look at data from an SRS of 1200 adults that asked about their marital s](https://dsd5zvtm8ll6.cloudfront.net/si.experts.images/questions/2022/09/63171caf4ba47_1662459054081.jpg)
Transcribed Image Text:
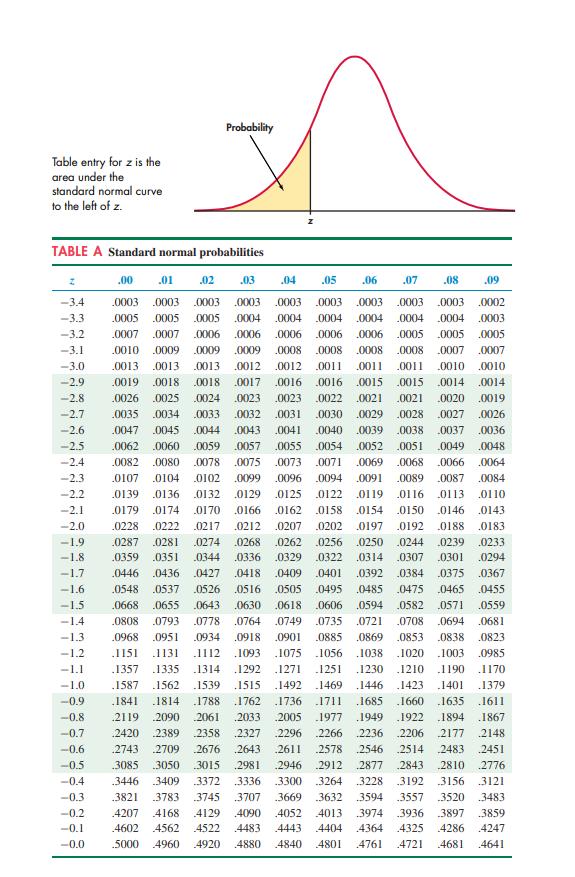
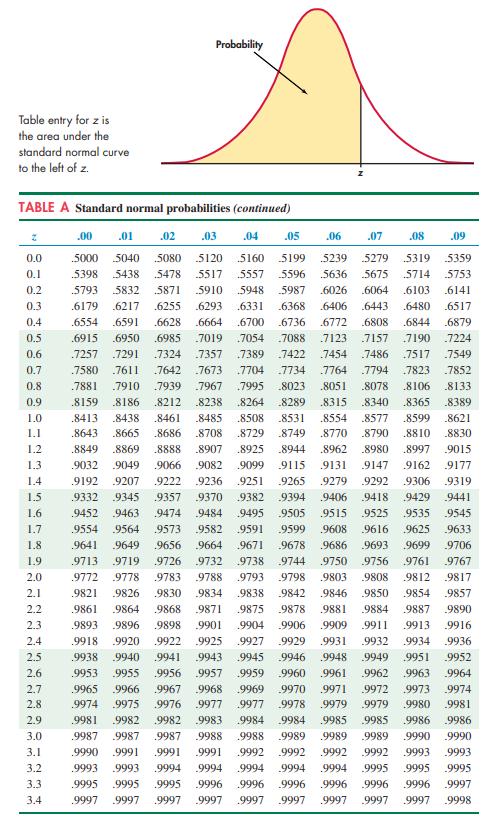
Question 3: Analysis of marital status [25 marks] We look at data from an SRS of 1200 adults that asked about their marital status. Out of those, 400 said they were happily married and 150 were married but facing relationship difficulties. The others were not married. Let X be the count of adults that are married. a. What is the sample size n for this survey? [2 marks] b. What value does X have? [3 marks] c. Find the sample proportion p. [4 marks] d. Calculate the large-sample confidence interval at 95%. [4 marks] Suppose you want to test (two-sided) if the population proportion is equal to 0.6. e. Write down the null and alternative hypotheses. [4 marks] f. Using Table A, calculate the p-value at the 5% significance level. [4 marks] g. Can you reject the null hypothesis? [4 marks] Table entry for z is the area under the standard normal curve to the left of z. Probability TABLE A Standard normal probabilities Z .00 .01 .02 .03 .04 .05 .06 .07 .08 .09 -3.4 .0003 .0003 .0003 .0003 .0002 -3.3 .0005 .0005 .0004 .0004 .0003 -3.2 -3.1 0003 .0003 .0003 .0003 .0003 0005 .0004 .0004 .0004 .0004 .0007 .0007 .0006 .0006 .0006 .0006 .0006 .0005 .0005 .0005 .0010 .0009 .0009 .0009 .0008 .0008 .0008 .0008 .0007 .0007 -3.0 .0013 .0013 .0013 .0012 .0012 .0011 -2.9 .0019 0018 .0018 .0017 .0016 .0016 -2.8 .0026 .0025 0024 .0023 .0023 .0022 -2.7 .0035 .0034 .0033 .0032 .0031 .0030 -2.6 .0047 .0045 0044 0043 .0041 .0040 -2.5 .0062 0060 .0059 .0057 .0055 .0054 .0082 .0080 .0078 .0075 .0073 .0071 .0011 .0011 .0010 0010 .0015 .0015 .0014 .0014 .0021 .0021 .0020 .0019 .0029 .0028 .0027 .0026 .0039 .0038 .0037 .0036 .0052 .0051 .0049 .0048 -2.4 .0069 .0068 .0066 .0064 -2.3 .0089 .0087 .0084 .0107 0104 .0102 .0099 .0129 .0096 .0094 .0091 .0125 0122 -2.2 .0139 .0136 .0132 .0119 .0116 .0113 .0110 -2.1 0179 .0174 0170 .0166 .0162 .0158 .0154 .0150 0146 .0143 0212 .0207 .0202 .0192 .0188 .0183 -2.0 .0228 .0222 .0217 -1.9 .0287 .0281 .0274 .0197 .0250 .0244 0239 0233 0268 .0262 0256 -1.8 0359 .0351 0344 0336 0294 -1.7 .0446 .0436 .0427 .0367 .0329 0322 .0314 .0307 .0301 .0409 .0401 .0392 .0384 .0375 .0505 .0495 .0618 .0606 0418 0526 0516 .0668 .0655 .0643 .0630 -1.6 .0548 .0537 .0455 .0808 .0793 .0778 0485 .0475 0465 .0594 .0582 .0571 .0559 .0764 .0749 0735 .0721 .0708 .0694 .0681 .0968 .0951 .0934 .0918 .0901 0885 .0869 .0853 0838 .0823 .1151 .1131 .1112 .1093 .1075 .1056 .1038 .1020 .1003 .0985 1357 1335 .1314 1292 .1271 1251 .1230 .1210 .1190 .1170 1587 1562 1539 1515 1492 .1469 .1446 .1423 .1401 .1379 .1841 .1814 1788 1762 .1736 1711 .1685 .1660 .1635 .1611 2119 .2090 2061 2033 .2005 1977 .1949 .1922 .1894 .1867 .2236 .2206 2177 2148 2546 .2912 2877 2843 2810 2776 3264 3228 .3192 .3156 .3121 3745 3707 .3669 3632 3594 .3557 .3520 3483 4052 4013 .3974 .3936 .3897 3859 4483 4443 .4404 .4364 4880 4840 4801 4761 .2420 2389 2358 2327 2296 .2266 2611 2578 2743 2709 2676 .2643 2514 2483 .2451 3085 .3050 3015 .2981 2946 .3446 .3409 3372 3336 .3300 .3821 .3783 4207 4168 4129 4090 4602 4562 4522 4325 4286 4247 5000 4960 4920 .4721 4681 .4641 -1.5 -1.4 -1.3 -1.2 -1.1 -1.0 -0.9 -0.8 -0,7 -0.6 -0.5 -0.4 -0.3 -0.2 -0.1 -0.0 Table entry for z is the area under the standard normal curve to the left of z. TABLE A Standard normal probabilities (continued) Z 0.0 0.1 0.2 0.3 0.4 0.5 0.6 0.7 0.8 0.9 1.0 1.1 1.2 1.3 1.4 1.5 1.6 1.7 1.8 1.9 2.0 2.1 2.2 2.3 2.4 2.5 2.6 Probability 2.7 2.8 2.9 3.0 3.1 3.2 3.3 3.4 .00 .01 .02 .03 .04 .05 .07 .08 .09 5279 .5319 .5359 5675 .5714 .5753 .5000 5040 5080 5120 .5160 5199 5398 5438 .5478 5517 5557 5793 5832 5871 5910 .5948 .6179 .6217 .6255 .6293 .6331 .6368 .6554 .6591 .6628 .6664 .6064 .6103 .6141 .6443 .6480 6517 .6808 .6844 .6879 .6915 .6950 .6985 .7019 .7054 .7123 .7157 7190 7224 .7257 .7291 .7324 .7357 .7389 .7454 .7486 7517 .7549 .7580 .7611 .7642 .7673 .7704 .7764 .7794 .7823 .7852 .7881 .7910 .7939 .7967 .7995 .8051 .8078 .8106 .8133 .8159 .8186 .8212 .8238 8264 .8315 .8340 .8365 .8389 .8413 .8438 .8461 .8485 .8508 .8531 .8554 .8577 .8599 .8621 .8643 .8665 .8686 .8708 .8729 -8749 .8770 .8790 .8810 .8830 .8849 .8869 .8888 .8907 .8925 .8944 .8962 .8980 .8997 9015 .9032 .9049 .9066 .9082 .9099 9115 .9131 .9147 .9162 9177 .9192 .9207 .9222 .9236 .9251 .9265 .9279 .9292 9306 9319 .9332 9345 .9357 .9370 .9382 9394 .9406 9418 9429 9441 9452 .9463 .9474 9484 9495 9505 .9515 .9525 9535 9545 .9554 .9564 .9573 .9582 .9591 9599 .9608 .9616 9625 9633 .9641 .9649 .9656 .9664 9671 9678 .9686 .9693 .9699 9706 .9719 .9726 9732 9738 9744 .9750 .9756 .9761 .9767 9713 .9772 .9778 9783 .9798 .9803 .9808 9812 9817 .9821 .9826 .9830 9842 .9846 .9850 9854 9857 9861 9864 9890 9788 .9793 .9834 9838 .9868 9871 .9875 .9893 .9896 .9898 .9901 .9904 .9918 .9920 .9922 9925 .9927 .9938 .9940 .9941 .9943 9878 .9881 .9884 9887 9906 .9909 .9911 9913 9916 .9929 .9931 .9932 .9934 .9936 .9946 9952 .9945 .9948 .9949 .9951 .9953 .9955 .9963 9964 9956 .9957 .9959 9960 9961 9962 .9967 .9968 .9969 .9970 9971 9972 9973 .9974 .9965 .9966 .9974 .9975 .9976 .9977 .9977 9978 .9979 9979 9980 .9981 .9985 9985 .9986 .9986 9989 .9989 .9990 .9990 .9993 9990 9991 .9991 9991 .9992 9992 .9992 9993 9981 9982 .9982 .9983 .9984 9984 9987 9987 9987 .9988 .9988 9989 9992 9994 .9994 9994 .9995 .9995 .9995 .9996 9996 .9996 .9997 .9997 .9997 .9997 .9997 .9997 .9993 9993 .9994 .9994 .9995 9995 .9995 9996 .9996 .9996 9997 .9997 .9997 .9997 .9998 .06 5239 5596 5636 -5987 .6026 .6406 .6700 .6736 .6772 .7088 .7422 7734 .8023 .8289 Question 3: Analysis of marital status [25 marks] We look at data from an SRS of 1200 adults that asked about their marital status. Out of those, 400 said they were happily married and 150 were married but facing relationship difficulties. The others were not married. Let X be the count of adults that are married. a. What is the sample size n for this survey? [2 marks] b. What value does X have? [3 marks] c. Find the sample proportion p. [4 marks] d. Calculate the large-sample confidence interval at 95%. [4 marks] Suppose you want to test (two-sided) if the population proportion is equal to 0.6. e. Write down the null and alternative hypotheses. [4 marks] f. Using Table A, calculate the p-value at the 5% significance level. [4 marks] g. Can you reject the null hypothesis? [4 marks] Table entry for z is the area under the standard normal curve to the left of z. Probability TABLE A Standard normal probabilities Z .00 .01 .02 .03 .04 .05 .06 .07 .08 .09 -3.4 .0003 .0003 .0003 .0003 .0002 -3.3 .0005 .0005 .0004 .0004 .0003 -3.2 -3.1 0003 .0003 .0003 .0003 .0003 0005 .0004 .0004 .0004 .0004 .0007 .0007 .0006 .0006 .0006 .0006 .0006 .0005 .0005 .0005 .0010 .0009 .0009 .0009 .0008 .0008 .0008 .0008 .0007 .0007 -3.0 .0013 .0013 .0013 .0012 .0012 .0011 -2.9 .0019 0018 .0018 .0017 .0016 .0016 -2.8 .0026 .0025 0024 .0023 .0023 .0022 -2.7 .0035 .0034 .0033 .0032 .0031 .0030 -2.6 .0047 .0045 0044 0043 .0041 .0040 -2.5 .0062 0060 .0059 .0057 .0055 .0054 .0082 .0080 .0078 .0075 .0073 .0071 .0011 .0011 .0010 0010 .0015 .0015 .0014 .0014 .0021 .0021 .0020 .0019 .0029 .0028 .0027 .0026 .0039 .0038 .0037 .0036 .0052 .0051 .0049 .0048 -2.4 .0069 .0068 .0066 .0064 -2.3 .0089 .0087 .0084 .0107 0104 .0102 .0099 .0129 .0096 .0094 .0091 .0125 0122 -2.2 .0139 .0136 .0132 .0119 .0116 .0113 .0110 -2.1 0179 .0174 0170 .0166 .0162 .0158 .0154 .0150 0146 .0143 0212 .0207 .0202 .0192 .0188 .0183 -2.0 .0228 .0222 .0217 -1.9 .0287 .0281 .0274 .0197 .0250 .0244 0239 0233 0268 .0262 0256 -1.8 0359 .0351 0344 0336 0294 -1.7 .0446 .0436 .0427 .0367 .0329 0322 .0314 .0307 .0301 .0409 .0401 .0392 .0384 .0375 .0505 .0495 .0618 .0606 0418 0526 0516 .0668 .0655 .0643 .0630 -1.6 .0548 .0537 .0455 .0808 .0793 .0778 0485 .0475 0465 .0594 .0582 .0571 .0559 .0764 .0749 0735 .0721 .0708 .0694 .0681 .0968 .0951 .0934 .0918 .0901 0885 .0869 .0853 0838 .0823 .1151 .1131 .1112 .1093 .1075 .1056 .1038 .1020 .1003 .0985 1357 1335 .1314 1292 .1271 1251 .1230 .1210 .1190 .1170 1587 1562 1539 1515 1492 .1469 .1446 .1423 .1401 .1379 .1841 .1814 1788 1762 .1736 1711 .1685 .1660 .1635 .1611 2119 .2090 2061 2033 .2005 1977 .1949 .1922 .1894 .1867 .2236 .2206 2177 2148 2546 .2912 2877 2843 2810 2776 3264 3228 .3192 .3156 .3121 3745 3707 .3669 3632 3594 .3557 .3520 3483 4052 4013 .3974 .3936 .3897 3859 4483 4443 .4404 .4364 4880 4840 4801 4761 .2420 2389 2358 2327 2296 .2266 2611 2578 2743 2709 2676 .2643 2514 2483 .2451 3085 .3050 3015 .2981 2946 .3446 .3409 3372 3336 .3300 .3821 .3783 4207 4168 4129 4090 4602 4562 4522 4325 4286 4247 5000 4960 4920 .4721 4681 .4641 -1.5 -1.4 -1.3 -1.2 -1.1 -1.0 -0.9 -0.8 -0,7 -0.6 -0.5 -0.4 -0.3 -0.2 -0.1 -0.0 Table entry for z is the area under the standard normal curve to the left of z. TABLE A Standard normal probabilities (continued) Z 0.0 0.1 0.2 0.3 0.4 0.5 0.6 0.7 0.8 0.9 1.0 1.1 1.2 1.3 1.4 1.5 1.6 1.7 1.8 1.9 2.0 2.1 2.2 2.3 2.4 2.5 2.6 Probability 2.7 2.8 2.9 3.0 3.1 3.2 3.3 3.4 .00 .01 .02 .03 .04 .05 .07 .08 .09 5279 .5319 .5359 5675 .5714 .5753 .5000 5040 5080 5120 .5160 5199 5398 5438 .5478 5517 5557 5793 5832 5871 5910 .5948 .6179 .6217 .6255 .6293 .6331 .6368 .6554 .6591 .6628 .6664 .6064 .6103 .6141 .6443 .6480 6517 .6808 .6844 .6879 .6915 .6950 .6985 .7019 .7054 .7123 .7157 7190 7224 .7257 .7291 .7324 .7357 .7389 .7454 .7486 7517 .7549 .7580 .7611 .7642 .7673 .7704 .7764 .7794 .7823 .7852 .7881 .7910 .7939 .7967 .7995 .8051 .8078 .8106 .8133 .8159 .8186 .8212 .8238 8264 .8315 .8340 .8365 .8389 .8413 .8438 .8461 .8485 .8508 .8531 .8554 .8577 .8599 .8621 .8643 .8665 .8686 .8708 .8729 -8749 .8770 .8790 .8810 .8830 .8849 .8869 .8888 .8907 .8925 .8944 .8962 .8980 .8997 9015 .9032 .9049 .9066 .9082 .9099 9115 .9131 .9147 .9162 9177 .9192 .9207 .9222 .9236 .9251 .9265 .9279 .9292 9306 9319 .9332 9345 .9357 .9370 .9382 9394 .9406 9418 9429 9441 9452 .9463 .9474 9484 9495 9505 .9515 .9525 9535 9545 .9554 .9564 .9573 .9582 .9591 9599 .9608 .9616 9625 9633 .9641 .9649 .9656 .9664 9671 9678 .9686 .9693 .9699 9706 .9719 .9726 9732 9738 9744 .9750 .9756 .9761 .9767 9713 .9772 .9778 9783 .9798 .9803 .9808 9812 9817 .9821 .9826 .9830 9842 .9846 .9850 9854 9857 9861 9864 9890 9788 .9793 .9834 9838 .9868 9871 .9875 .9893 .9896 .9898 .9901 .9904 .9918 .9920 .9922 9925 .9927 .9938 .9940 .9941 .9943 9878 .9881 .9884 9887 9906 .9909 .9911 9913 9916 .9929 .9931 .9932 .9934 .9936 .9946 9952 .9945 .9948 .9949 .9951 .9953 .9955 .9963 9964 9956 .9957 .9959 9960 9961 9962 .9967 .9968 .9969 .9970 9971 9972 9973 .9974 .9965 .9966 .9974 .9975 .9976 .9977 .9977 9978 .9979 9979 9980 .9981 .9985 9985 .9986 .9986 9989 .9989 .9990 .9990 .9993 9990 9991 .9991 9991 .9992 9992 .9992 9993 9981 9982 .9982 .9983 .9984 9984 9987 9987 9987 .9988 .9988 9989 9992 9994 .9994 9994 .9995 .9995 .9995 .9996 9996 .9996 .9997 .9997 .9997 .9997 .9997 .9997 .9993 9993 .9994 .9994 .9995 9995 .9995 9996 .9996 .9996 9997 .9997 .9997 .9997 .9998 .06 5239 5596 5636 -5987 .6026 .6406 .6700 .6736 .6772 .7088 .7422 7734 .8023 .8289
Expert Answer:

Related Book For 

Elementary Statistics Picturing the World
ISBN: 978-0321911216
6th edition
Authors: Ron Larson, Betsy Farber
Posted Date:
Students also viewed these accounting questions
-
Find the area under the standard normal curve to the left of z = 2.13. a. Draw the standard normal curve and shade the area under the curve and to the left of z = 2.13. b. Use the Standard Normal...
-
a. Find the area under the standard normal curve to the left of z = 0 P(z < 0) b. Find the area under the standard normal curve to the right of z = 0 P(z> 0)
-
Find the area under the standard normal curve to the right of z = -2.16. a. Draw the standard normal curve and shade the area under the curve and to the right of z = -2.16. b. Use the Standard Normal...
-
For the planning process, it is helpful to have employee census information for Question 3 options: a) at least the last five years and projections for the future. b) all current employees younger...
-
The value of a sports franchise is directly related to the amount of revenue that a franchise can generate. The file BBValues represents the value in 2014 (in $ millions) and the annual revenue (in $...
-
For those seventh graders with cell phones, the number of programmed numbers in their phones are: a. Find the mean number of programmed numbers on a seventh graders cell phone. b. Find the median...
-
Discuss why it is important to report significant changes in a patients condition to the treating physician.
-
During the most recent year, Butler paid $95,000 in interest to its lenders and $80,000 in dividends to its stockholders. Required 1. In which category of the statement of cash flows (operating,...
-
Consider a simple loan. Draw up a table that shows the present value (PV) given the following variables. Show all your calculations. < Present Value (PV) Cash Flow (CF) Interest Rate (i) Term (n)...
-
1. In each situation, what are the main financial planning issues that need to be addressed? 2. What additional information would you like to have before recommending actions in each situation? 3....
-
You are operating a small casual dining restaurant "ArteSano" in the downtown area of Kanata You have determined the following expenses for the Month of May 2023. Utilities $135,870.00 Food Cost...
-
Cuevas Co. is in the process of developing a revolutionary new product. A new division of the company was formed to develop, manufacture, and market this new product. As of year-end (December 31,...
-
Villa Company has experienced tough competition, leading it to seek concessions from its employees in the companys pension plan. In exchange for promises to avoid layoffs and wage cuts, the employees...
-
On January 1, 2013, a machine was purchased for \($90\),000. The machine has an estimated residual value of \($6\),000 and an estimated useful life of 5 years. The machine can operate for 100,000...
-
On June 30, 2015, your client, Ferry Company, was granted two patents covering plastic cartons that it had been producing and marketing profitably for the past 3 years. One patent covers the...
-
Pick a social media website and evaluate the communication interactions that occur there. Does the interpersonal communication on the website foster open discussion, or are many people maligned for...
-
3. Write the Jack code that produces the following transaction with the user. Note: the green text indicates input from the user. Please enter number 1: 21 Please enter number 2: 19 Please enter...
-
Diamond Walker sells homemade knit scarves for $25 each at local craft shows. Her contribution margin ratio is 60%. Currently, the craft show entrance fees cost Diamond $1,500 per year. The craft...
-
A researcher tests the braking distances of several cars. The braking distance from 60 miles per hour to a complete stop on dry pavement is measured in feet. The braking distances of a sample of cars...
-
The amounts of time per workout an athlete uses a stairclimber are normally distributed, with a mean of 20 minutes and a standard deviation of 5 minutes. Find the probability that a randomly selected...
-
In the frequency distribution in Example 9, 599.5 was chosen as the midpoint for the class of $500 or more. How does the sample mean and standard deviation change when the midpoint of this class is...
-
The government regularly publishes many different economic statistics, such as the unemployment rate, the inflation rate, and the surplus or deficit in the federal budget. Study recent newspapers and...
-
Prove that the dual function of Eq. (16.12) is concave Data From Equation (16.12) 19S See https://www.gams.com/ 20 See http://cvxr.com/
-
Consider the quadratic programming problem. min x+x s.t. 1x2 = 4. x1

Study smarter with the SolutionInn App