

Question: The line vacillates up and down throughout. It begins at 18 in 1881 and rises to 24 in the early 1900s. The line then descends
The line vacillates up and down throughout. It begins at 18 in 1881 and rises to 24 in the early 1900s. The line then descends erratically to 3 in 1920 before drastically rising to 32 in 1930. The line suddenly drops to 6, bounces to 22 and goes to 15 in 1940. The line rises to 24 in the mid-1960s before descending to 6 in the early 1980s. A jump to 18 in 1990 and then to 48 in 2000 is followed by a drop to 13 in 2010 and a rise to 27 in 2016.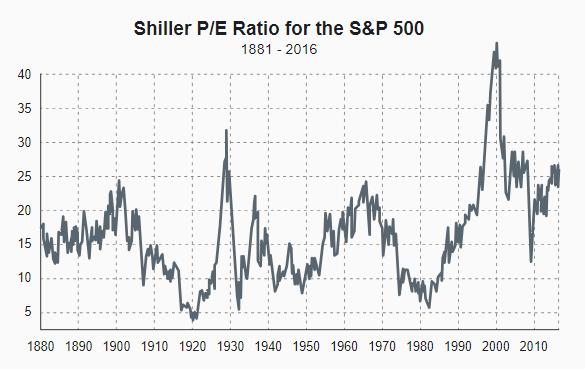 The overall P/E ratio for the market seems to be slowly increasing, and the spikes seem to be getting larger. What do you think is causing this?
40 35 30 25 20 15 10 5 Shiller P/E Ratio for the S&P 500 1881 - 2016 When y 1880 1890 1900 1910 1920 1930 1940 1950 1960 1970 1980 1990 2000 2010
Step by Step Solution
3.39 Rating (152 Votes )
There are 3 Steps involved in it
SOLUTION Based on the provided data the Shiller PE Ratio for the SP 500 has shown fluctuation over time It is important to note that the Shiller PE Ra... View full answer

Get step-by-step solutions from verified subject matter experts