

Question: the Link: https://phet.colorado.edu/sims/html/wave-interference/latest/wave-interference_en.html And the photos are in order of the document __________________________________________________________________________________________________________________________________________ The tables for you guys to paste the data into AN -antinodal


the Link: https://phet.colorado.edu/sims/html/wave-interference/latest/wave-interference_en.html
And the photos are in order of the document
__________________________________________________________________________________________________________________________________________
The tables for you guys to paste the data into
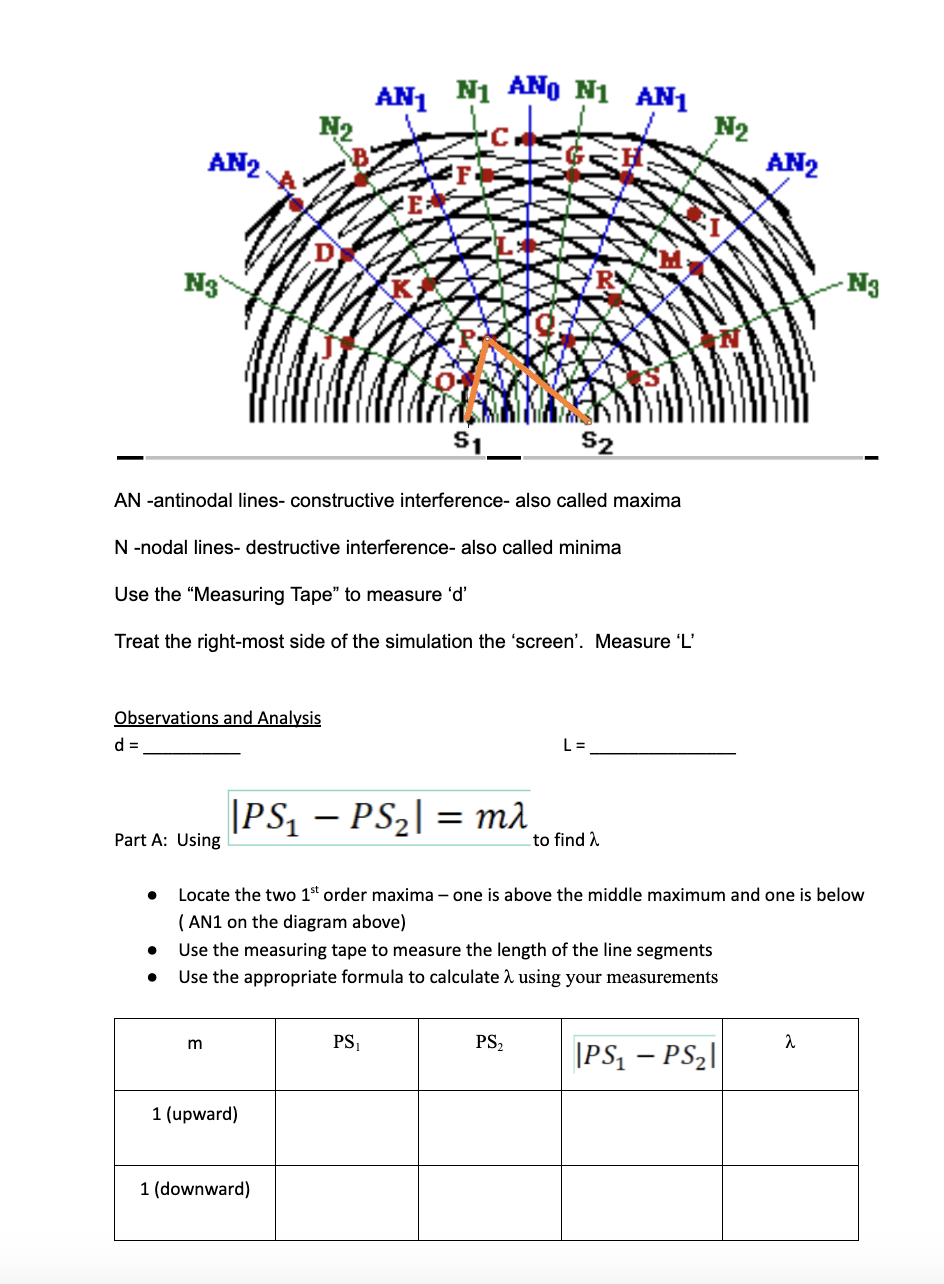
AN -antinodal lines- constructive interference- also called maxima
N -nodal lines- destructive interference- also called minima
Use the "Measuring Tape" to measure 'd'
Treat the right-most side of the simulation the 'screen'. Measure 'L'
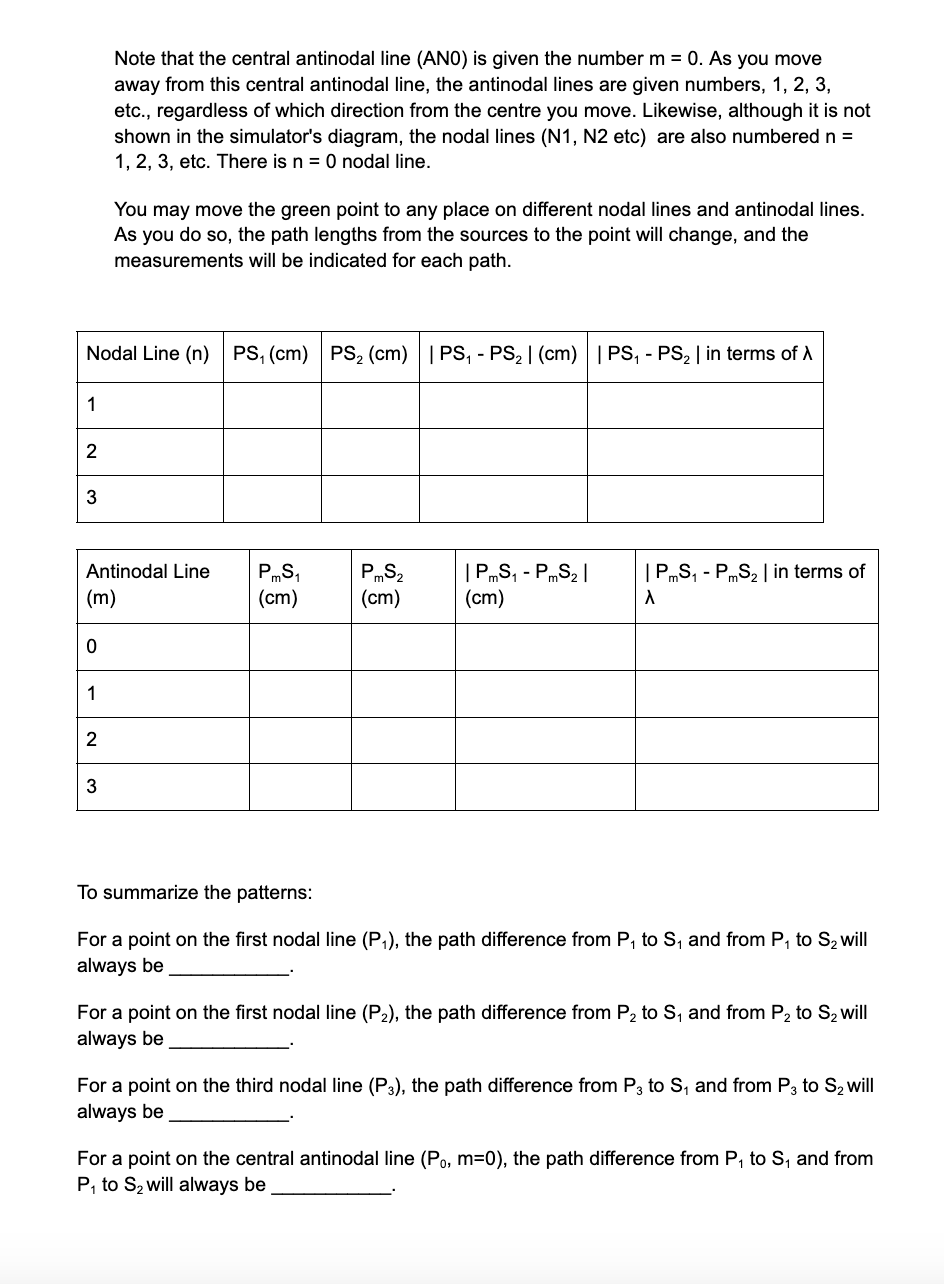
Observations and Analysis
d = __________ L = _______________
Part A: Using
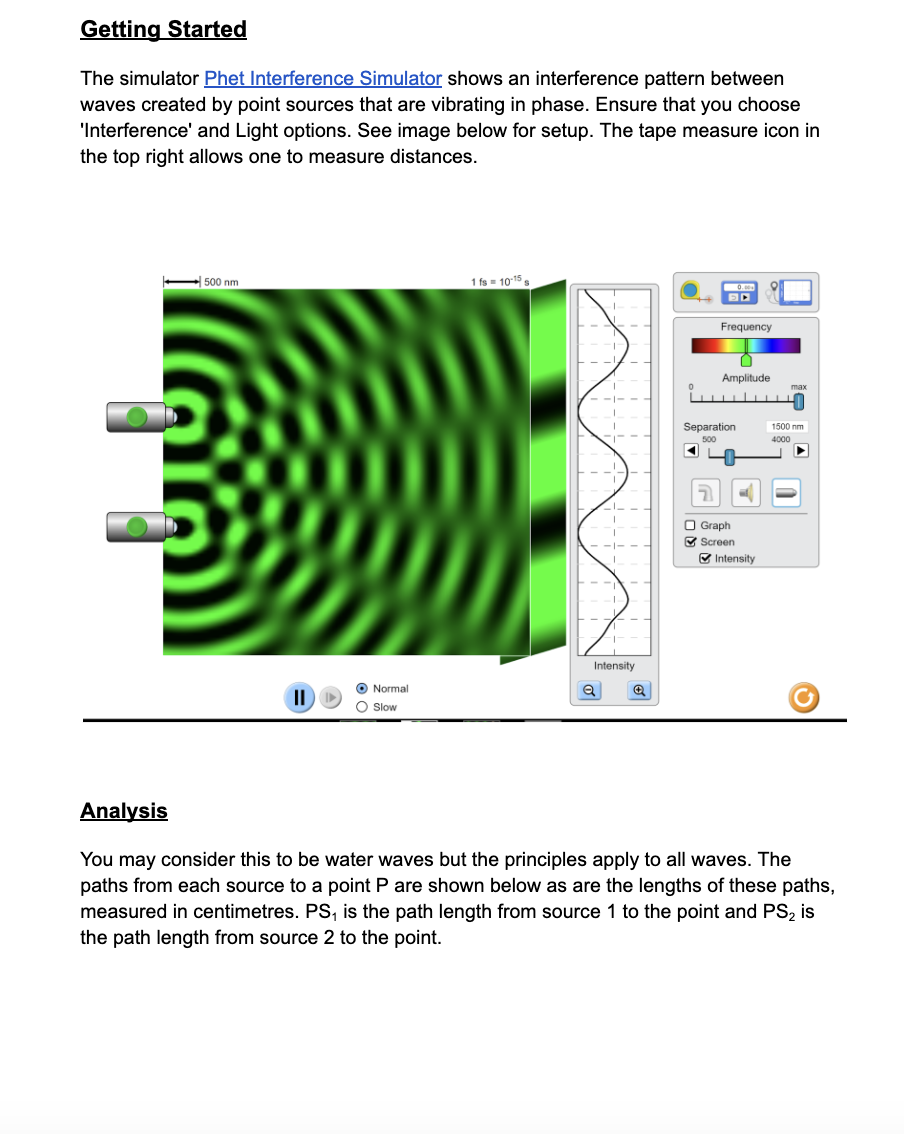


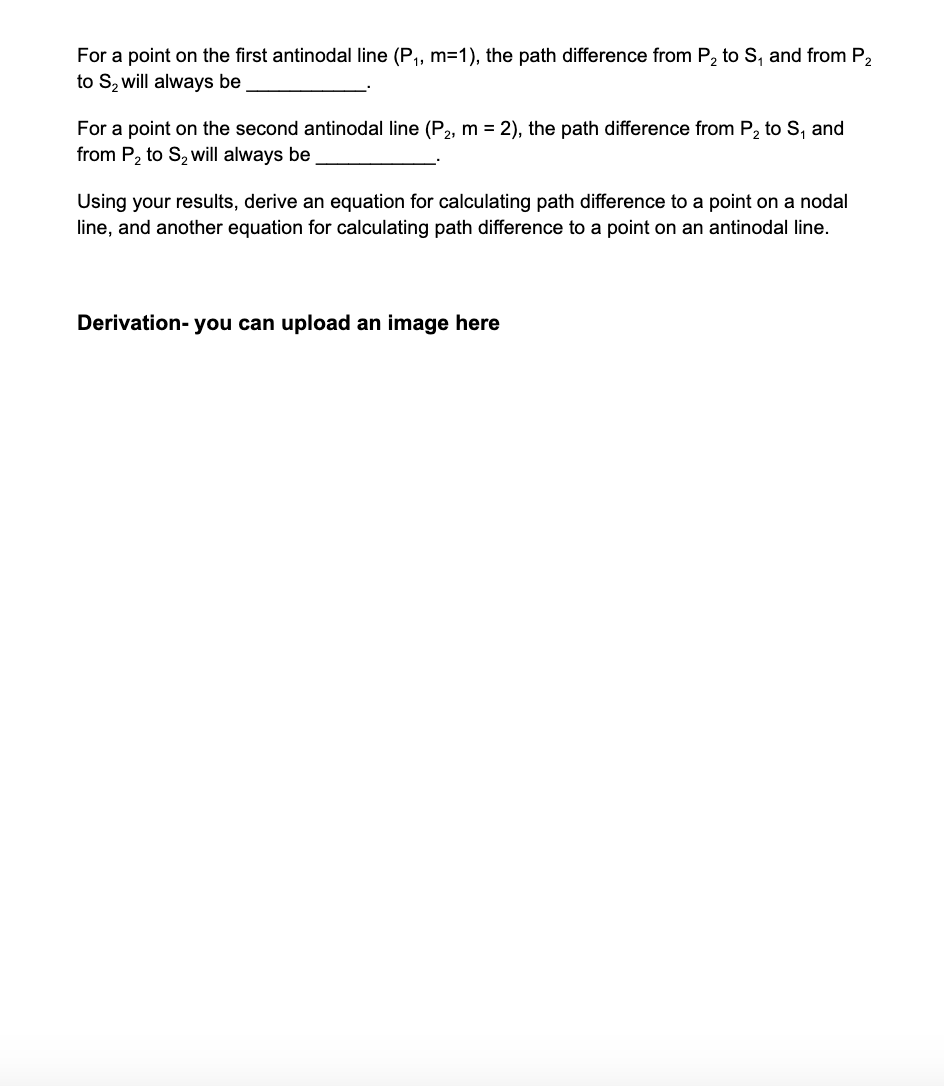
Getting Started The simulator Fhet Interference Simulator shows an interference pattern between waves created by point sources that are vibrating in phase. Ensure that you choose 'lnterference' and Light options. See image below for setup. The tape measure icon in the top right allows one to measure distances. Amplnmde I U Ira: I Ll_|_|_l_|_|_|_l_le I l Separation '50[- -m I _J soc Icon 1 31 u b I I ll I : 3 Graph I 3 Screen I B Intensity I I _ _ _l_ _ I "I , (9 Normal 3| 3| J 2 0 Slow ) Analysis You may consider this to be water waves but the principles apply to all waves. The paths from each source to a point P are shown below as are the lengths of these paths. measured in centimetres. PS1 is the path length from source 1 to the point and P82 is the path length from source 2 to the point. \fNote that the central antinodal line (AND): is given the number m = 0. As you move away from this central antinodal line, the antinodal lines are given numbers, 1, 2, 3, etc., regardless of which direction from the centre you move. Likewise, although it is not shown in the simulator's diagram, the nodal lines (N1, N2 etc) are also numbered n = 'l, 2, 3, etc. There is n = D nodal line. You may move the green point to any place on different nodal lines and antinodal lines. As you do so, the path lengths from the sources to the point will change, and the measurements will be indicated for each path. Nodal Line (n) PS1 (cm) PS2 (cm) | PS1 - PS2 | (cm) | PS1 - PS2 | in terms ofh Antinodal Line F',,,Sl F'mS2 | PmS, - F,,,S2 | | PmS, - F,,,S2 | in terms of (m) (cm) (cm) (cm) A 0 To summarize the patterns: Fora point on the rst nodal line (F.}, the path difference from P1 to S1 and from P1 to 82 will always be For a point on the rst nodal line (F2), the path difference from P2 to S1 and from P2 to 82 will always be Fora point on the third nodal line (P3), the path difference from P3 to S1 and from P3 to 32 will always be For a point on the central antinodal line (PD, m=0), the path difference from P1 to S1 and from P1 to 82 will always be Fora point on the rst antinodal line {P1, m=1}, the path difference from P2 to SI and from P2 to 82 will always be For a point on the second antinodal line (P2. m = 2), the path difference from P2 to S1 and from P2 to Szwill always be Using your results, derive an equation for calculating path difference to a point on a nodal line, and another equation for calculating path difference to a point on an antinodal line. Derivation- you can upload an image here
Step by Step Solution
There are 3 Steps involved in it

Get step-by-step solutions from verified subject matter experts