

Question: the main question is on page with web scraping heading and please write the subsequent answer as format given in other two pictures... Web scraping
the main question is on page with web scraping heading and please write the subsequent answer as format given in other two pictures...
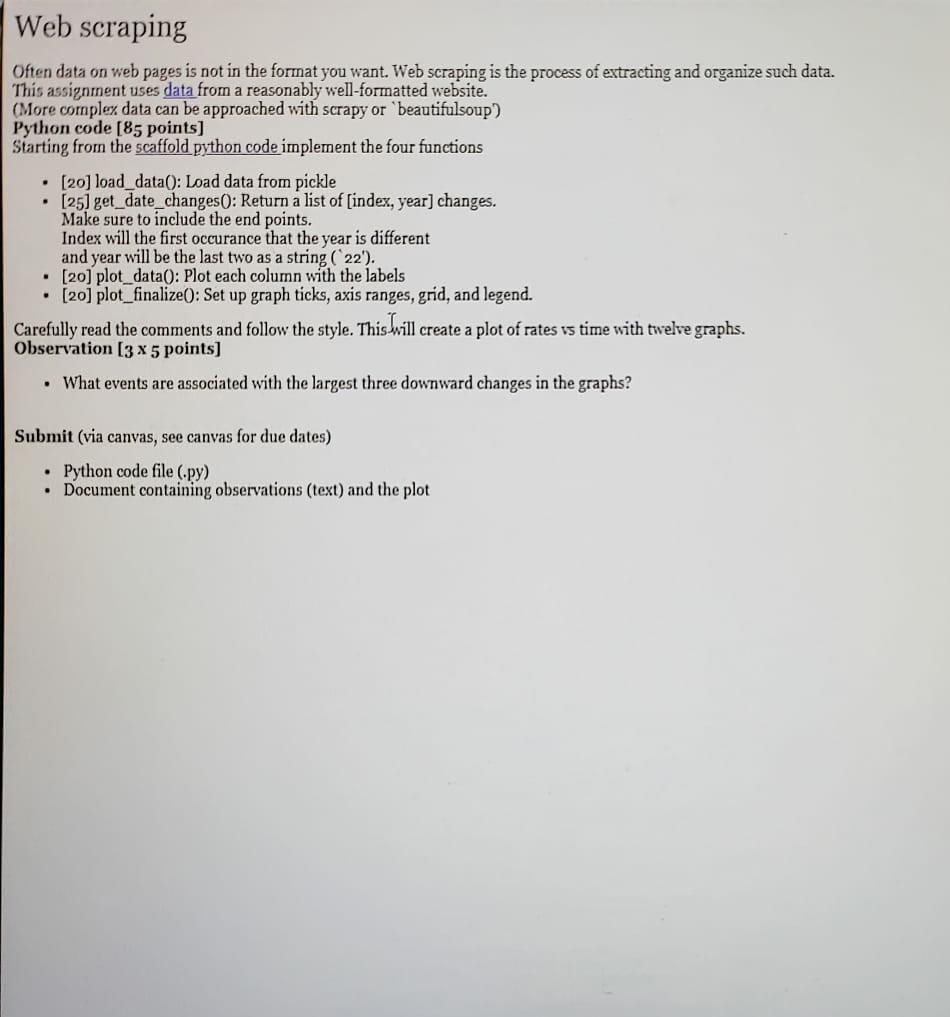
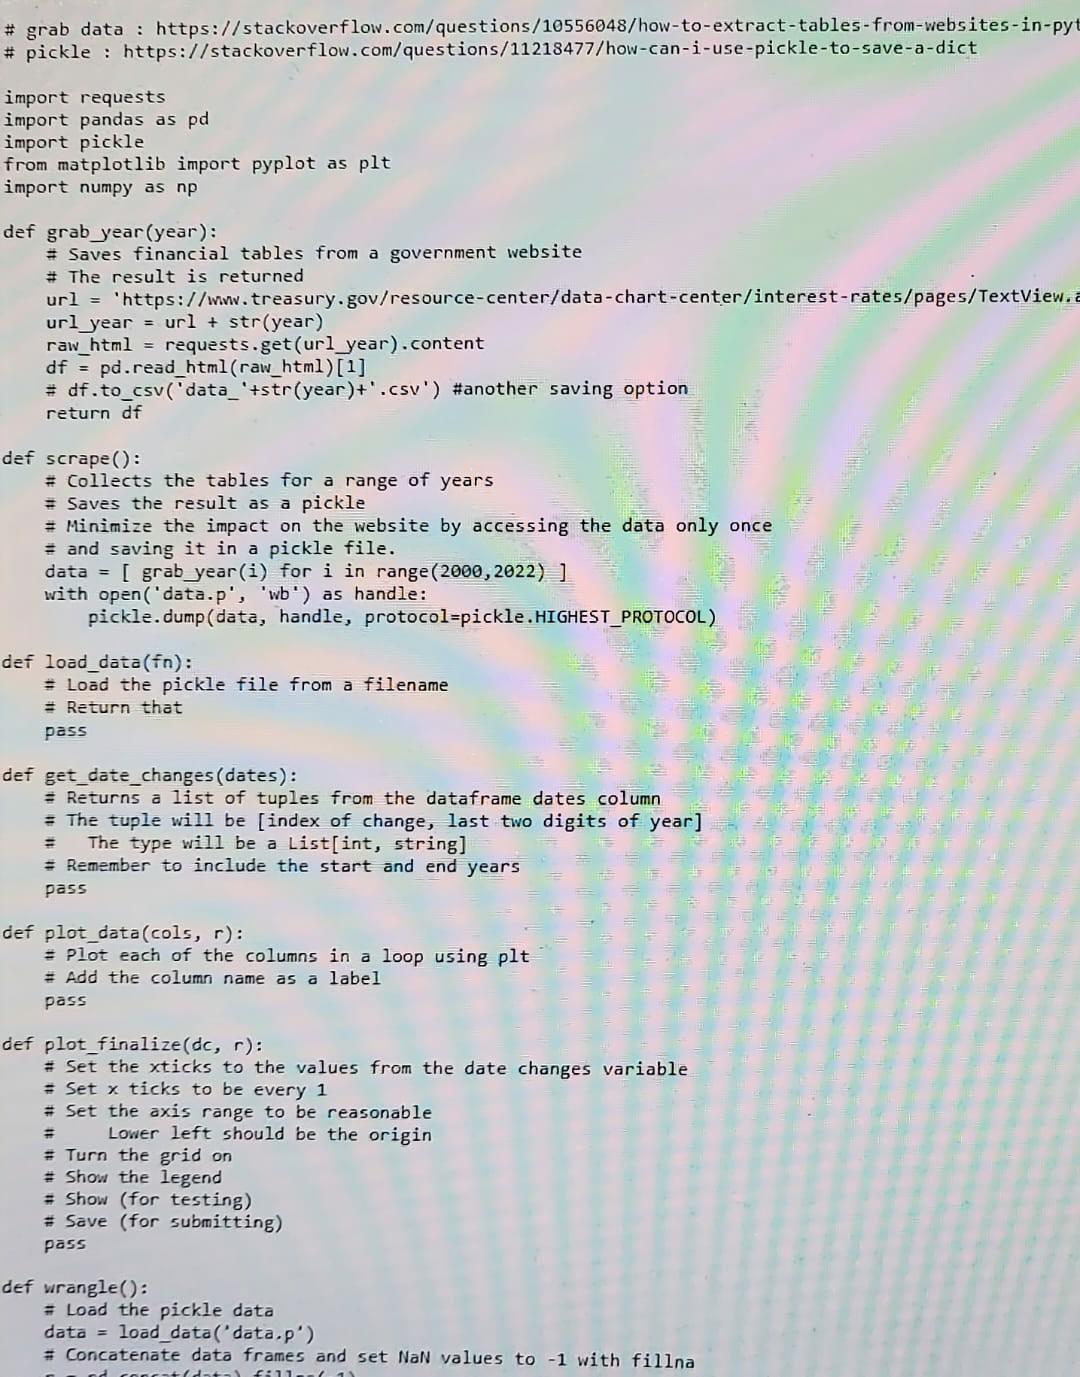
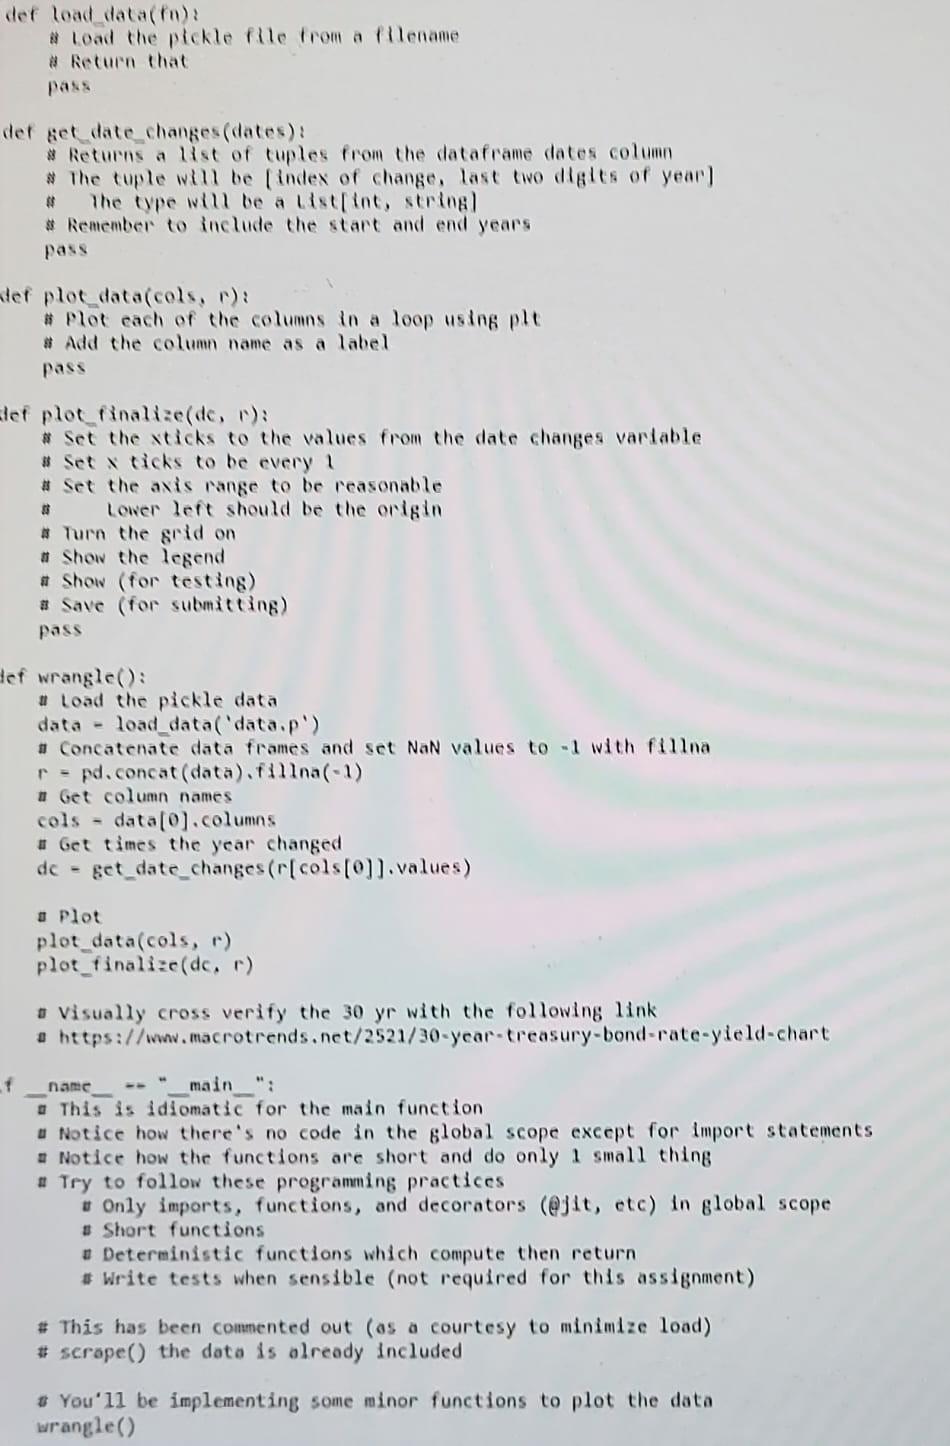
Web scraping Often data on web pages is not in the format you want. Web scraping is the process of extracting and organize such data. This assignment uses data from a reasonably well-formatted website. (More complex data can be approached with scrapy or beautifulsoup) Python code [85 points) Starting from the scaffold python code implement the four functions (20) load_data(): Load data from pickle [25] get_date_changes(): Return a list of (index, year] changes. Make sure to include the end points. Index will the first occurance that the year is different and year will be the last two as a string (22'). . [20] plot_data(): Plot each column with the labels . [20] plot_finalize(): Set up graph ticks, axis ranges, grid, and legend. Carefully read the comments and follow the style. This will create a plot of rates vs time with twelve graphs. Observation (3 x 5 points) What events are associated with the largest three downward changes in the graphs? Submit (via canvas, see canvas for due dates) Python code file (.py) Document containing observations (text) and the plot # grab data : https://stackoverflow.com/questions/10556048/how-to-extract-tables-from-websites-in-pyt # pickle : https://stackoverflow.com/questions/11218477/how-can-i-use-pickle-to-save-a-dict import requests import pandas as pd import pickle from matplotlib import pyplot as plt import numpy as np def grab year(year): #Saves financial tables from a government website # The result is returned url = "https://www.treasury.gov/resource-center/data-chart-center/interest-rates/pages/TextView.a url year = url + str(year) raw_html = requests.get(url_year).content df = pd.read_html(raw_html)[1] = df.to_csv('data_'+str(year)+'.csv') #another saving option return df def scrape(): # Collects the tables for a range of years Saves the result as a pickle = Minimize the impact on the website by accessing the data only once and saving it in a pickle file. data = [ grab_year(i) for i in range (2000,2022)) with open('data.p', 'wb') as handle: pickle. dump (data, handle, protocol=pickle.HIGHEST_PROTOCOL) def load_data(in): = load the pickle file from a filename = Return that pass def get_date_changes (dates): Returns a list of tuples from the dataframe dates column = The tuple will be [index of change, last two digits of year] The type will be a List[int, string] Remember to include the start and end years pass - def plot_data(cols, r): = Plot each of the columns in a loop using plt = Add the column name as a label pass = def plot_finalize(dc, r): # Set the xticks to the values from the date changes variable = Set x ticks to be every 1 # Set the axis range to be reasonable Lower left should be the origin Turn the grid on # Show the legend = Show (for testing) # Save (for submitting) pass def wrangle(): = Load the pickle data data = load_data('data.p') Concatenate data frames and set NaN values to -1 with fillna tadat f 11 def load_data(fa) # Load the pickle Ple from a filename # Return that der get date changes (dates): # Returns a list of cuples from the dataframe dates column # The cuple will be (index of change, last two digits of year! # The type will be a list[int, string # Remember to include the start and end years pass ter ploc_data(cols, ): # Plot each of the columns in a loop using ple # Add the column name as a label pass 3 lef plot finalize(de, ): # Set the sticks to the values from the date changes variable Set dicks to be every 1 # Set the axis range to be reasonable Lower lent should be the origin # Turn the grid on # Show the legend # Show (for testing) # Save (for submitting) pass Hef wrangle(): # Load the pickle data data - load_data('data,p') # Concatenate data frames and set NaN values to with fillna r = pd.concat(data).fina(-1) # Get column names cols - data[0).columns # Get times the year changed get_date_changes (r[cols[0]).values) dc - Plot plot_data(cols, r) plot_finalized, r) Visually cross verify the 30 yr with the following link a https://www.macrotrends.net/2521/30-year-treasury-bond-rate-yield-chart f name main ": This is idiomatic for the main function u Notice how there's no code in the global scope except for import statements . Notice how the functions are short and do only 1 small thing . Try to follow these programming practices Only imports, functions, and decorators (@jit, etc) in global scope # Short functions # Deterministic functions which compute then return # Write tests when sensible (not required for this assignment) # This has been commented out (os a courtesy to minimize lood) # scrape() the data is olready included # You'll be implementing some minor functions to plot the data wrangle()
Step by Step Solution
There are 3 Steps involved in it

Get step-by-step solutions from verified subject matter experts