

Question: The map below displays the average amount spent by public schools in each state during the 2019-2020 school year as reported by the National Center
The map below displays the average amount spent by public schools in each state during the 2019-2020 school year as reported by the National Center for Education Statistics (NCES) website. report comparing the amounts eastern states spent to educate their children to the amounts spent by western states. We will define an eastern state as any state that lies east of the Mississippi River and a western state as any state that lies west of the Mississippi River. A complete report will include
- An introduction that defines the context of the variables (visit website for more information)
- Two (2) histograms. The first should depict spending in eastern states while the second should depict spending in western states. You may wish to group spending amounts into bins of size $1000 (or more). It is recommended you hand draw your histograms; however, histograms created online will be accepted.
- Appropriate statistics and descriptions for each display (shape, center, spread). It might be beneficial to enter your data into EXCEL to simplify these calculations.
- A conclusion that provides a well written description of the expenditures.
MAKE SURE TO INCLUDE PICTURE OF THE HISTOGRAMS CREATED!!
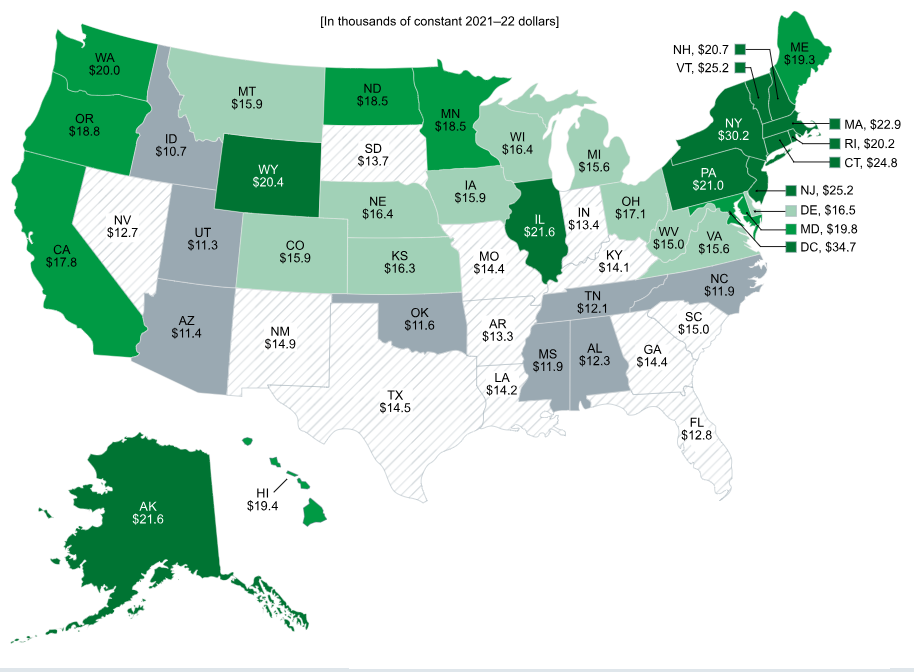
[In thousands of constant 2021-22 dollars] WA NH, $20.7 ME $20.0 VT, $25.2 $19.3 MT ND $15.9 $18.5 OR MN $18.8 $18.5 NY MA, $22.9 ID WI $30.2 $10.7 SD $16.4 MI RI, $20.2 WY $13.7 $15.6 PA CT, $24.8 $20.4 IA $21.0 NE $15.9 NJ, $25.2 OH NV $16.4 IL IN $17.1 DE, $16.5 $12.7 UT $21.6 $13.4 WV MD, $19.8 CA $11.3 CO VA $15.0 $15.6 $17.8 $15.9 KS MC KY DC, $34.7 $16.3 $14.4 $14.1 NC TN $11.9 AZ OK $12.1 SC $11.4 NM $11.6 AR $15.0 $14.9 $13.3 MS AL GA $11.9 $12.3 $14.4 LA TX $14.2 $14.5 FL $12.8 HI AK $19.4 $21.6
Step by Step Solution
There are 3 Steps involved in it

Get step-by-step solutions from verified subject matter experts