

Question: *THE MAP NEEDS TO BE FILLED IN ON PAGE 2 1) Analyze the current process. Fill in the process flow diagram on page 2 of
*THE MAP NEEDS TO BE FILLED IN ON PAGE 2
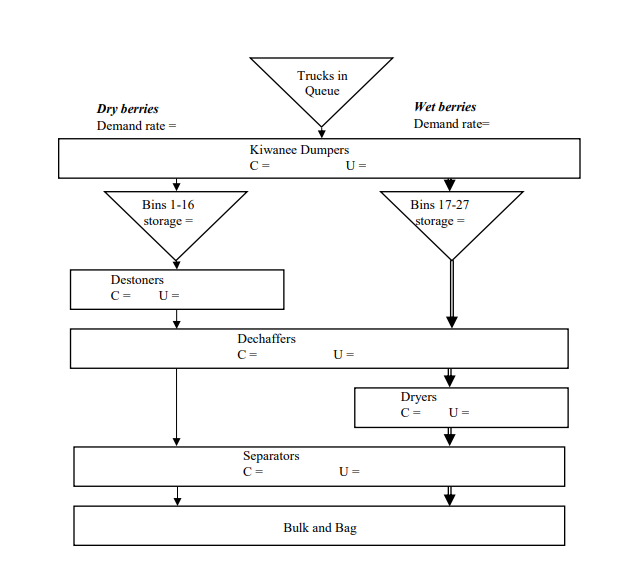
1) Analyze the current process. Fill in the process flow diagram on page 2 of the guideline for the current process at Receiving Plant #1. Mark the capacity and utilization of each of the operations. Show the flows of the wet and dry berries separately.
What is the capacity of the Kiwanee Dumpers?
Group of answer choices
1500
2000
3000
4500
2) Analyze the current process. Fill in the process flow diagram on page 2 of the guideline for the current process at Receiving Plant #1. Mark the capacity and utilization of each of the operations. Show the flows of the wet and dry berries separately.
What is the storage capacity of bins 1 - 16?
Group of answer choices
4000
650
600
4500
3) Analyze the current process. Fill in the process flow diagram on page 2 of the guideline for the current process at Receiving Plant #1. Mark the capacity and utilization of each of the operations. Show the flows of the wet and dry berries separately.
What is the storage capacity of bins 17 - 27?
Group of answer choices
4500
3000
3200
4000
4) Analyze the current process. Fill in the process flow diagram on page 2 of the guideline for the current process at Receiving Plant #1. Mark the capacity and utilization of each of the operations. Show the flows of the wet and dry berries separately.
What is the capacity of the destoners?
Group of answer choices
4500
3500
3000
4000
5) Analyze the current process. Fill in the process flow diagram on page 2 of the guideline for the current process at Receiving Plant #1. Mark the capacity and utilization of each of the operations. Show the flows of the wet and dry berries separately.
What is the capacity of the dechaffers?
Group of answer choices
3000
4500
3500
4000
6) Analyze the current process. Fill in the process flow diagram on page 2 of the guideline for the current process at Receiving Plant #1. Mark the capacity and utilization of each of the operations. Show the flows of the wet and dry berries separately.
What is the capacity of the dryers?
Group of answer choices
600
1200
1500
1800
7) Analyze the current process. Fill in the process flow diagram on page 2 of the guideline for the current process at Receiving Plant #1. Mark the capacity and utilization of each of the operations. Show the flows of the wet and dry berries separately.
What is the capacity of the separators?
Group of answer choices
1800
1200
600
1500
8) On a busy day, what is RP#1's current maximum throughput rate?
Group of answer choices
1500
1050
1250
1100
9) Which of the following is NOT a capital investment considered by NCC?
Group of answer choices
Converting dechaffer
Light-meter
Extra dryer
Extra Kiwanee Dumper
Converting bins
10) Adding a fifth Kiwanee Dumper lowers truck waiting time (True or False).
Group of answer choices
True
False
11) How many bins do you need to convert to wet/dry bins to eliminate driver waiting time?
Group of answer choices
8 - 9
5 - 6
6 - 7
4 - 5
12) An additional benefit of converting enough bins to wet/dry bins to eliminate truck waiting is that overtime is reduced as well (True/False).
Group of answer choices
True
False
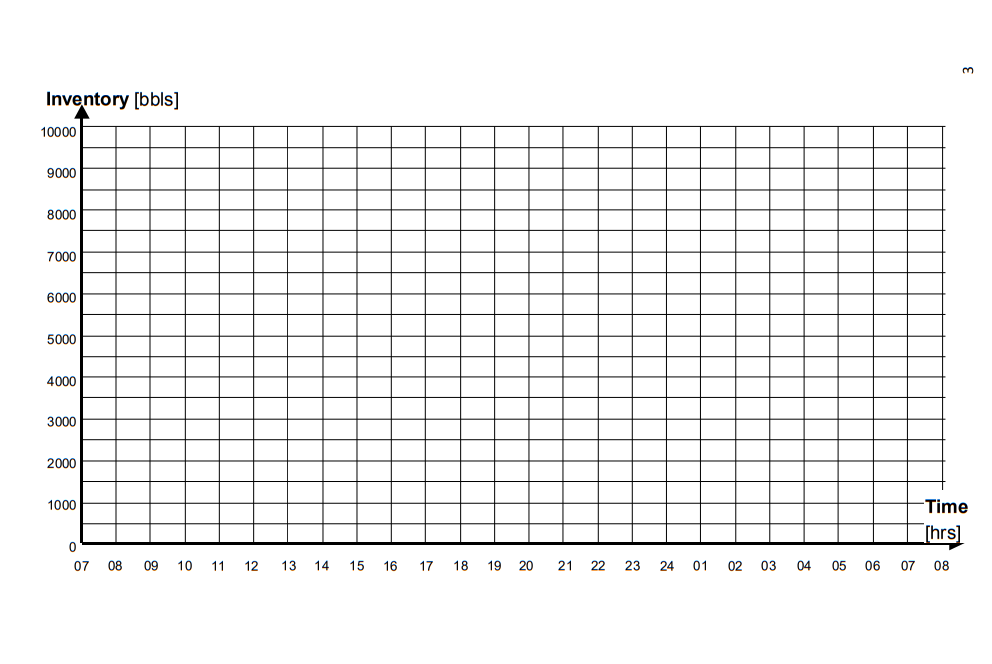
13) construct an inventory build-up diagram for bins and trucks to describe a busy day.
Assume that processing starts at 7 am on a "busy" day.
National Cranberry Guideline Please read the course pack item National Cranberry Cooperative Consider the following case assumptions: A. All the processes (including Destone, Dechaff, and Dry) start at 7am. B. On an average busy" day, there are 18,000 bbls delivered over 12-hour period (from 7am to 7pm). C. Wet berries are 70% of all berries. D. Holding bins 17-24 are dedicated to wet berries. E. It takes 7.5 minutes to back a truck onto a Kiwanee dumper. The capacity of each truck is 75 bbls. F. Capacity of the Dechaffers and Separators are not divided for dry and wet berries. Assignment: 1. Fill out the Process Flow Map on page 2. (Bring to class) 2. Construct the inventory build-up diagram for the system on page 3. Please indicate the total inventory level, the inventory level in the bins and the inventory stored in the trucks. (Bring to class) 3. Answer the questions on Canvas Trucks in Queue Dry berries Demand rate = Wet berries Demand rate= Kiwanee Dumpers C= U= Bins 1-16 storage = Bins 17-27 storage = Destoners C= U= Dechaffers C= U= Dryers C= U= Separators C= U= Bulk and Bag m Inventory [bbls] 10000 9000 8000 7000 6000 5000 4000 3000 2000 1000 -Time [hrs] 0 07 08 09 10 11 12 13 14 15 16 17 18 19 20 21 22 23 24 01 02 03 04 05 06 07 08Step by Step Solution
There are 3 Steps involved in it

Get step-by-step solutions from verified subject matter experts