

The march 2007 issue of consumer reports presents data about airline maintenance. The following table presents the
Question:
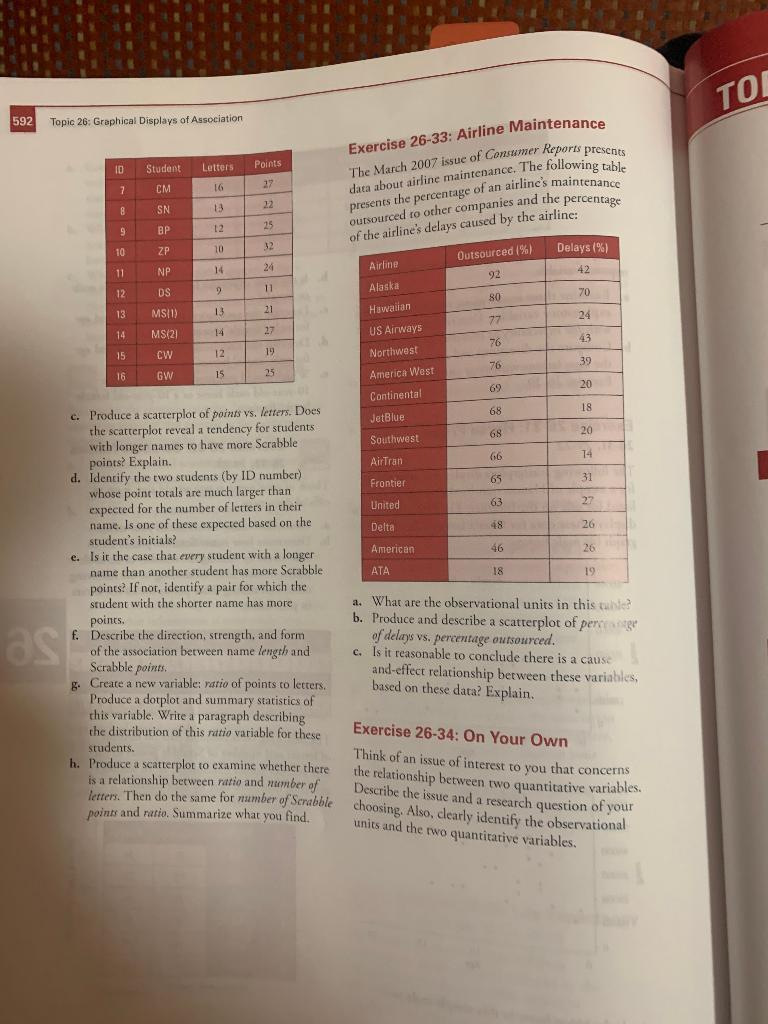
The march 2007 issue of consumer reports presents data about airline maintenance. The following table presents the percentage of an airline's maintenance outsourced to other companies and the percentage of the airline's delays caused by the airlines:
airline. outsourced(%). Delays.
Alaska 92. 42
Hawain. 80 70
Us Airways 77 24
Northwest 76 43
AmericanWest 76 39
Continental. 69. 20
jetblue 68 18
southwest 68 20
airtran 66 14
frontier 65 31
united 63 27
delta 48 26
American 46 26
ATA 18 29
a. What are the observational units in this table?
b. Produce and describe a scaterplot of percentage of delays vs. percentage out sourced.
c. is it reasonable to conclude there is a cause and effect relationship between these variables, based on these data? explain
Expert Answer:
TOI Exercise 2633 Airline Maintenance Letters CM 16 27 8 outsourced to other companies and the of the airlines delays caus Show transcribed image text ... View the full answer


An Introduction to Statistical Methods and Data Analysis
ISBN: 978-1305269477
7th edition
Authors: R. Lyman Ott, Micheal T. Longnecker
