

Use the regressors (x_{2}) (passing yardage), (x_{7}) (percentage of rushing plays), and (x_{8}) (opponents' yards rushing) for
Question:
Use the regressors \(x_{2}\) (passing yardage), \(x_{7}\) (percentage of rushing plays), and \(x_{8}\) (opponents' yards rushing) for the National Football League data in Table B.1.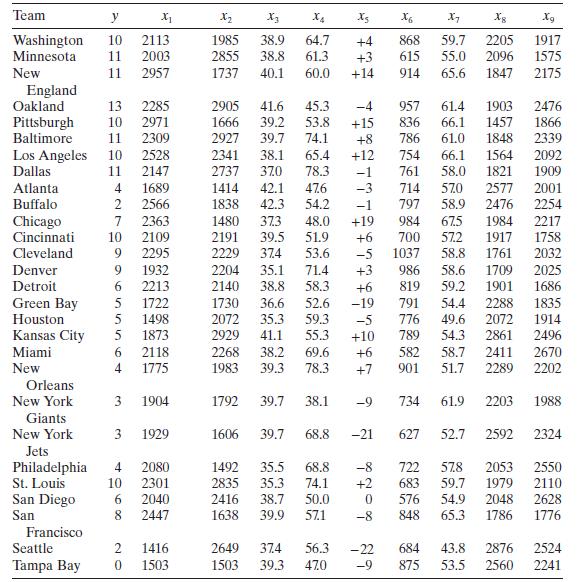
a. Does the correlation matrix give any indication of multicollinearity?
b. Calculate the variance inflation factors and the condition number of \(\mathbf{X}^{\prime} \mathbf{X}\). Is there any evidence of multicollinearity?
Fantastic news! We've Found the answer you've been seeking!
Step by Step Answer:

Answered By
Muhammad Umair
I have done job as Embedded System Engineer for just four months but after it i have decided to open my own lab and to work on projects that i can launch my own product in market. I work on different softwares like Proteus, Mikroc to program Embedded Systems. My basic work is on Embedded Systems. I have skills in Autocad, Proteus, C++, C programming and i love to share these skills to other to enhance my knowledge too.
1+ Reviews
10+ Question Solved
Related Book For 

Introduction To Linear Regression Analysis
ISBN: 9781119578727
6th Edition
Authors: Douglas C. Montgomery, Elizabeth A. Peck, G. Geoffrey Vining
Question Posted:
