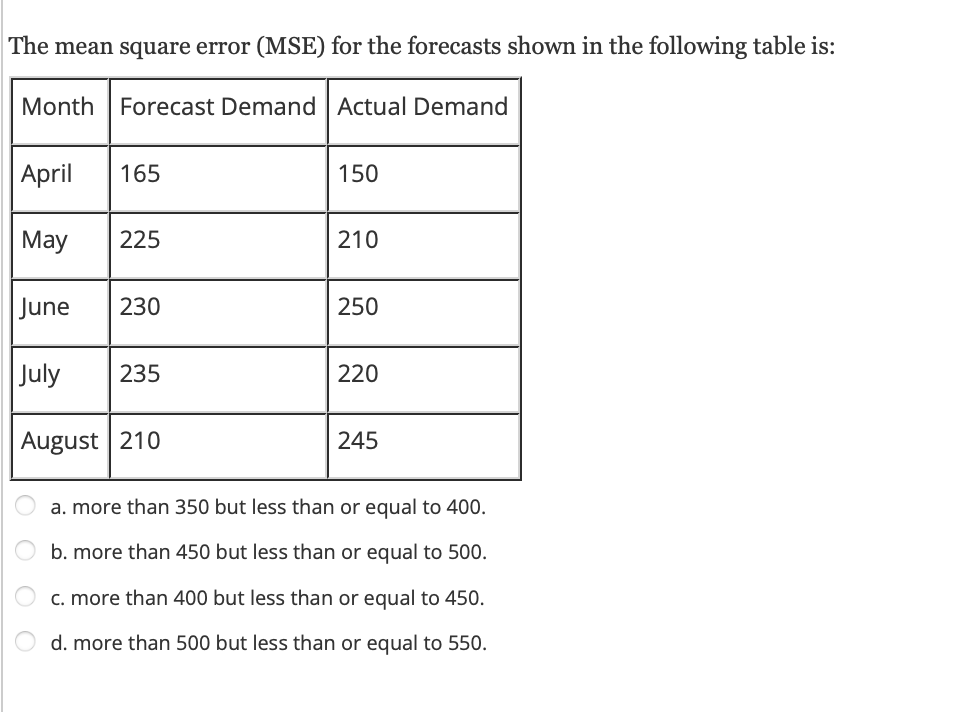
Question: The mean square error (MSE) for the forecasts shown in the following table is: a. more than 350 but less than or equal to 400

The mean square error (MSE) for the forecasts

The mean square error (MSE) for the forecasts shown in the following table is: a. more than 350 but less than or equal to 400 . b. more than 450 but less than or equal to 500 . c. more than 400 but less than or equal to 450 . d. more than 500 but less than or equal to 550

Step by Step Solution

There are 3 Steps involved in it

1 Expert Approved Answer
Step: 1 Unlock blur-text-image
Question Has Been Solved by an Expert!

Get step-by-step solutions from verified subject matter experts

Step: 2 Unlock
Step: 3 Unlock

Students Have Also Explored These Related General Management Questions!