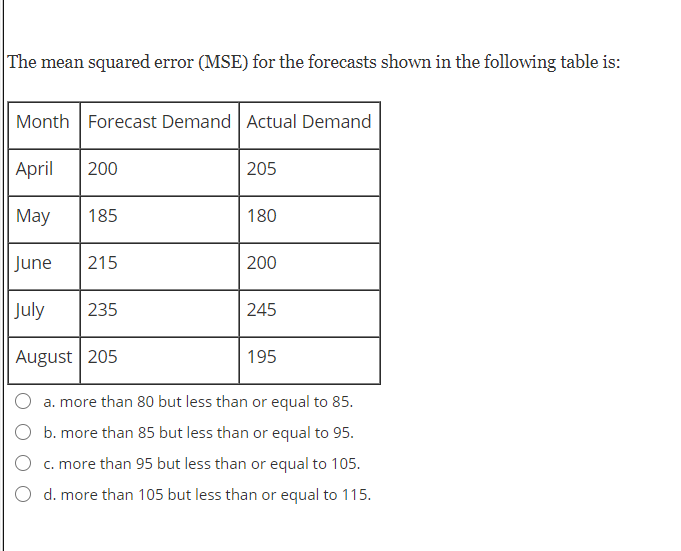
Question: The mean squared error (MSE) for the forecasts shown in the following table is: Month Forecast Demand Actual Demand April 200 205 May 185 180

The mean squared error (MSE) for the forecasts

The mean squared error (MSE) for the forecasts shown in the following table is: Month Forecast Demand Actual Demand April 200 205 May 185 180 June 215 200 July 235 245 August | 205 195 a. more than 80 but less than or equal to 85. O b. more than 85 but less than or equal to 95. O c. more than 95 but less than or equal to 105. O d. more than 105 but less than or equal to 115

Step by Step Solution

There are 3 Steps involved in it

1 Expert Approved Answer
Step: 1 Unlock blur-text-image
Question Has Been Solved by an Expert!

Get step-by-step solutions from verified subject matter experts

Step: 2 Unlock
Step: 3 Unlock

Students Have Also Explored These Related General Management Questions!