

Question: The method outline in class is the excel data analysis add in. It has t and z tests and can do descriptive statistics. I believe
"The method outline in class is the excel "data analysis" add in". It has t and z tests and can do descriptive statistics. I believe this is a t test.
Data set: https://www.dropbox.com/scl/fi/fbs140enk6nbiic1u8fxf/Exam.xlsx?dl=0&rlkey=20de1v4o9sx2sw1qj9ymcc75b
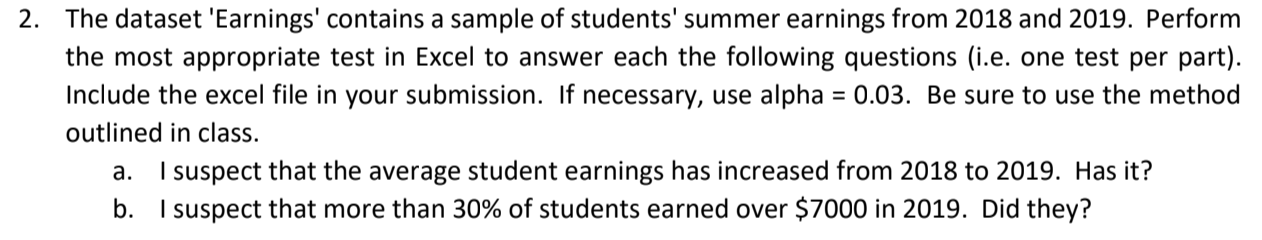
2. The dataset 'Earnings' contains a sample of students' summer earnings from 2018 and 2019. Perform the most appropriate test in Excel to answer each the following questions (i.e. one test per part). Include the excel file in your submission. If necessary, use alpha = 0.03. Be sure to use the method outlined in class. a. I suspect that the average student earnings has increased from 2018 to 2019. Has it? b. I suspect that more than 30% of students earned over $7000 in 2019. Did they
Step by Step Solution
There are 3 Steps involved in it

Get step-by-step solutions from verified subject matter experts