

Question: The midterm contains two questions. Please solve these prob - lems in R and knit a pdf report. The report includes the question description, your
The midterm contains two questions. Please solve these prob
lems in R and knit a pdf report. The report includes the question
description, your solution and any comments if necessary.
Question : points
Download daily equity data of JPM and WFC to
Calculate both the daily log return and weekly log return for each stock.
Visualize the distribution of these log returns using hist function. Use
par function to put the four histogram together into one single graph,
where each histogram is an individual subplot.
Calculate the first four moments, ie mean, variance, skewness and kur
tosis, for each stock. Store the calculate result in a data frame and report
the result in a table.
Draw a scatter plot of JPM daily return against WFC daily return. ie
WFC return on xaxis and JPM return on yaxis
Build a simple linear regression model using the WFC daily return as ex
planatory variable and the JPM daily return as response variable. Report
the fitted model using summary function.
Draw a regression line on the scatter plot using the fitted model above.
Make sure use a different color to draw the regression line.
Question : points
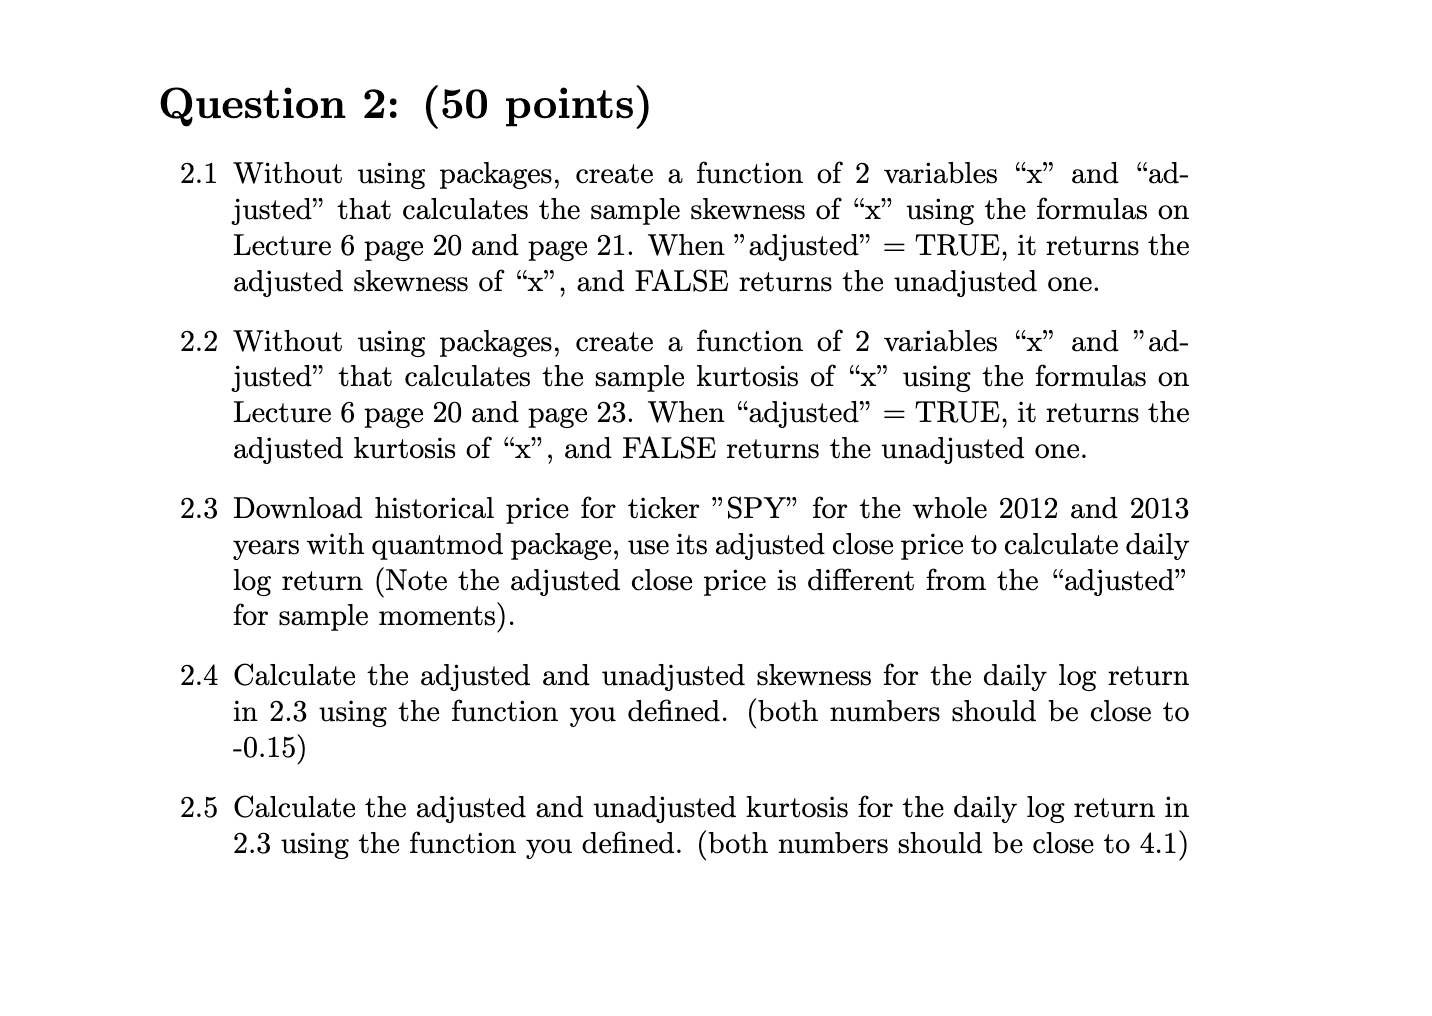
Without using packages, create a function of variables x and "adjusted" that calculates the sample skewness of x using the formulas on Lecture page and page When "adjusted" TRUE, it returns the adjusted skewness of x and FALSE returns the unadjusted one.
Without using packages, create a function of variables x and "adjusted" that calculates the sample kurtosis of x using the formulas on Lecture page and page When "adjusted" TRUE, it returns the adjusted kurtosis of x and FALSE returns the unadjusted one.
Download historical price for ticker SPY for the whole and years with quantmod package, use its adjusted close price to calculate daily log return Note the adjusted close price is different from the "adjusted" for sample moments
Calculate the adjusted and unadjusted skewness for the daily log return in using the function you defined. both numbers should be close to
Calculate the adjusted and unadjusted kurtosis for the daily log return in using the function you defined. both numbers should be close to The midterm contains two questions. Please solve these problems in R and knit a pdf report. The report includes the question description, your solution and any comments if necessary.
Question : points
Download daily equity data of JPM and WFC to
Calculate both the daily log return and weekly log return for each stock.
Visualize the distribution of these log returns using hist function. Use operatornamepar function to put the four histogram together into one single graph, where each histogram is an individual subplot.
Calculate the first four moments, ie mean, variance, skewness and kurtosis, for each stock. Store the calculate result in a data frame and report the result in a table.
Draw a scatter plot of JPM daily return against WFC daily return. ie WFC return on xaxis and JPM return on yaxis
Build a simple linear regression model using the WFC daily return as explanatory variable and the JPM daily return as response variable. Report the fitted model using summary function.
Draw a regression line on the scatter plot using the fitted model above. Make sure use a different color to draw the regression line.
Step by Step Solution
There are 3 Steps involved in it
1 Expert Approved Answer
Step: 1 Unlock

Question Has Been Solved by an Expert!
Get step-by-step solutions from verified subject matter experts
Step: 2 Unlock
Step: 3 Unlock