

Question: The Normal Distribution Activity The Normal Distribution Activity For Data Set 3 For Data Set 2 Data Set 1 Data Set 2 Data Set 3
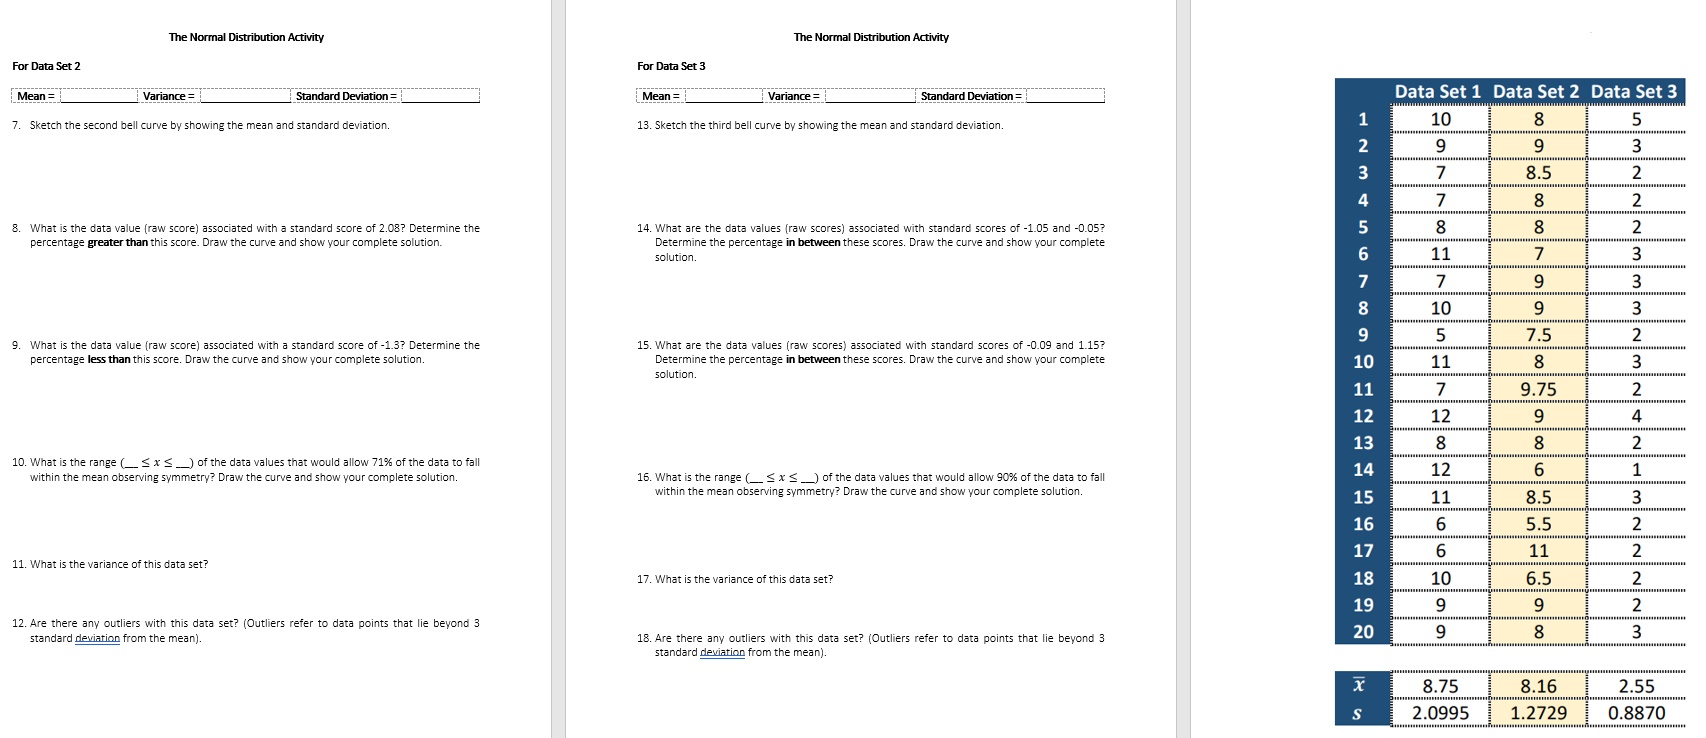
The Normal Distribution Activity The Normal Distribution Activity For Data Set 3 For Data Set 2 Data Set 1 Data Set 2 Data Set 3 Mean = Variance = Standard Deviation = Mean = Standard Deviation = 10 8 5 Variance = 13. Sketch the third bell curve by showing the mean and standard deviation. 9 9 3 7. Sketch the second bell curve by showing the mean and standard deviation. N 3 7 8.5 2 7 8 2 8 8 2 14. What are the data values (raw scores) associated with standard scores of -1.05 and -0.05? 8. What is the data value (raw score) associated with a standard score of 2.08? Determine the Determine the percentage in between these scores. Draw the curve and show your complete 11 7 3 percentage greater than this score. Draw the curve and show your complete solution. solution. 7 9 3 10 9 3 5 7.5 2 15. What are the data values (raw scores) associated with standard scores of -0.09 and 1.15? 11 8 3 9. What is the data value (raw score) associated with a standard score of -1.3? Determine the Determine the percentage in between these scores. Draw the curve and show your complete 10 percentage less than this score. Draw the curve and show your complete solution. solution. 11 7 9.75 2 12 12 9 4 13 8 8 14 12 6 1 10. What is the range (_S x S __) of the data values that would allow 71% of the data to fall 16. What is the range (_S x S _) of the data values that would allow 90% of the data to fall within the mean observing symmetry? Draw the curve and show your complete solution. 11 3 within the mean observing symmetry? Draw the curve and show your complete solution. 15 8.5 16 6 5.5 2 17 6 11 2 18 10 6.5 2 11. What is the variance of this data set? 17. What is the variance of this data set? 19 9 9 2 20 9 3 12. Are there any outliers with this data set? (Outliers refer to data points that lie beyond 3 18. Are there any outliers with this data set? (Outliers refer to data points that lie beyond 3 standard deviation from the mean). standard deviation from the mean). x 8.75 8.16 2.55 S 2.0995 1.2729 0.8870
Step by Step Solution
There are 3 Steps involved in it

Get step-by-step solutions from verified subject matter experts