

Question: The null hypothesis is H0: 1=2 and the alternative hypothesis is Ha: 1>2. The data in the accompanying table are from a simple random paired
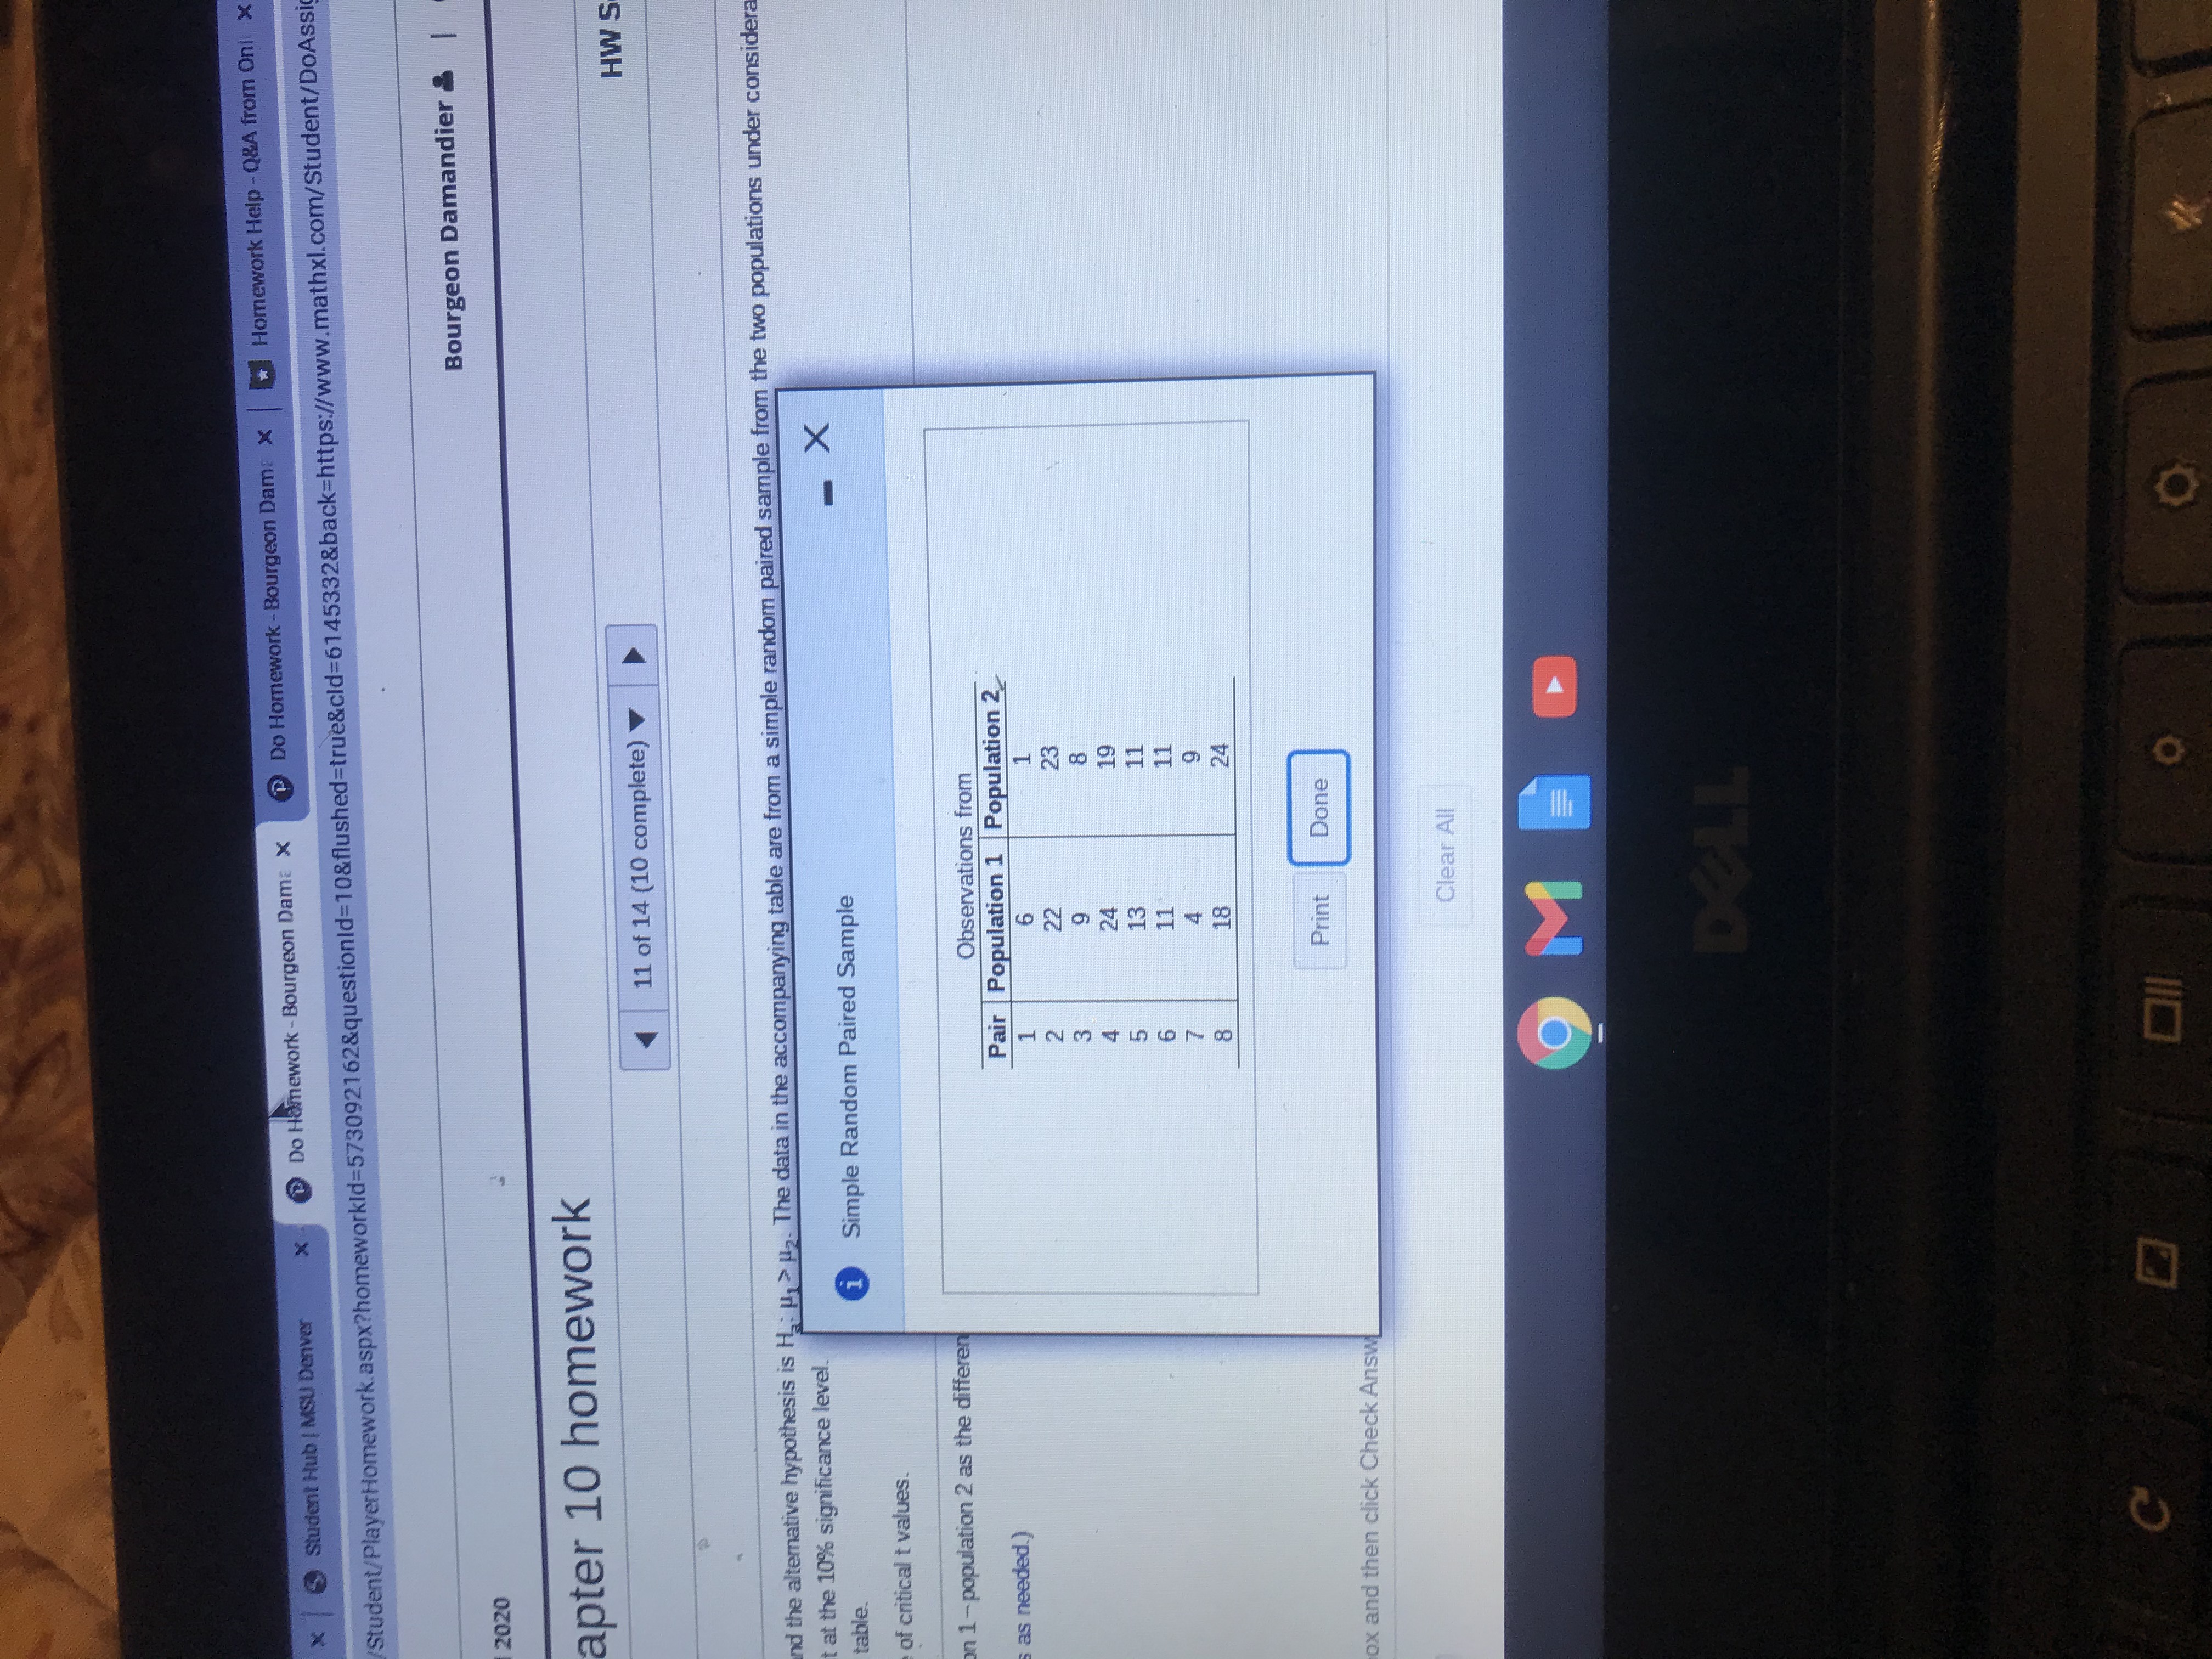
The null hypothesis is H0: 1=2 and the alternative hypothesis is Ha: 1>2. The data in the accompanying table are from a simple random paired sample from the two populations under consideration. Use the pairedt-test to perform the required hypothesis test at the 10% significance level.
Find the test statistic. Use population 1population 2 as the difference.
T=__________
Student Hub | MSU Denver X Do Hamework - Bourgeon Dame X Do Homework - Bourgeon Dame x Homework Help - Q&A from Onl x Student/PlayerHomework. aspx?homeworkld=573092162&questionld=10&flushed=true&cld=6145332&back=https://www.mathxl.com/Student/DoAssi 2020 Bourgeon Damandier & | apter 10 homework 11 of 14 (10 complete) HW nd the alternative hypothesis is H.: My > 12. The data in the accompanying table are from a simple random paired sample from the two populations under consider t at the 10% significance level. table Simple Random Paired Sample - X of critical t values n 1 -population 2 as the differen Observations from as needed.) Pair Population 1 Population 2 CO -OUT ALONE 23 19 11 11 24 Print Done ox and then click Check Ans Clear All 9M DELL C
Step by Step Solution
There are 3 Steps involved in it

Get step-by-step solutions from verified subject matter experts