

Question: The Nyquist plot given by MATLAB for a certain system with K = 1 is shown in Figure 1 . Note that the Nyquist plot
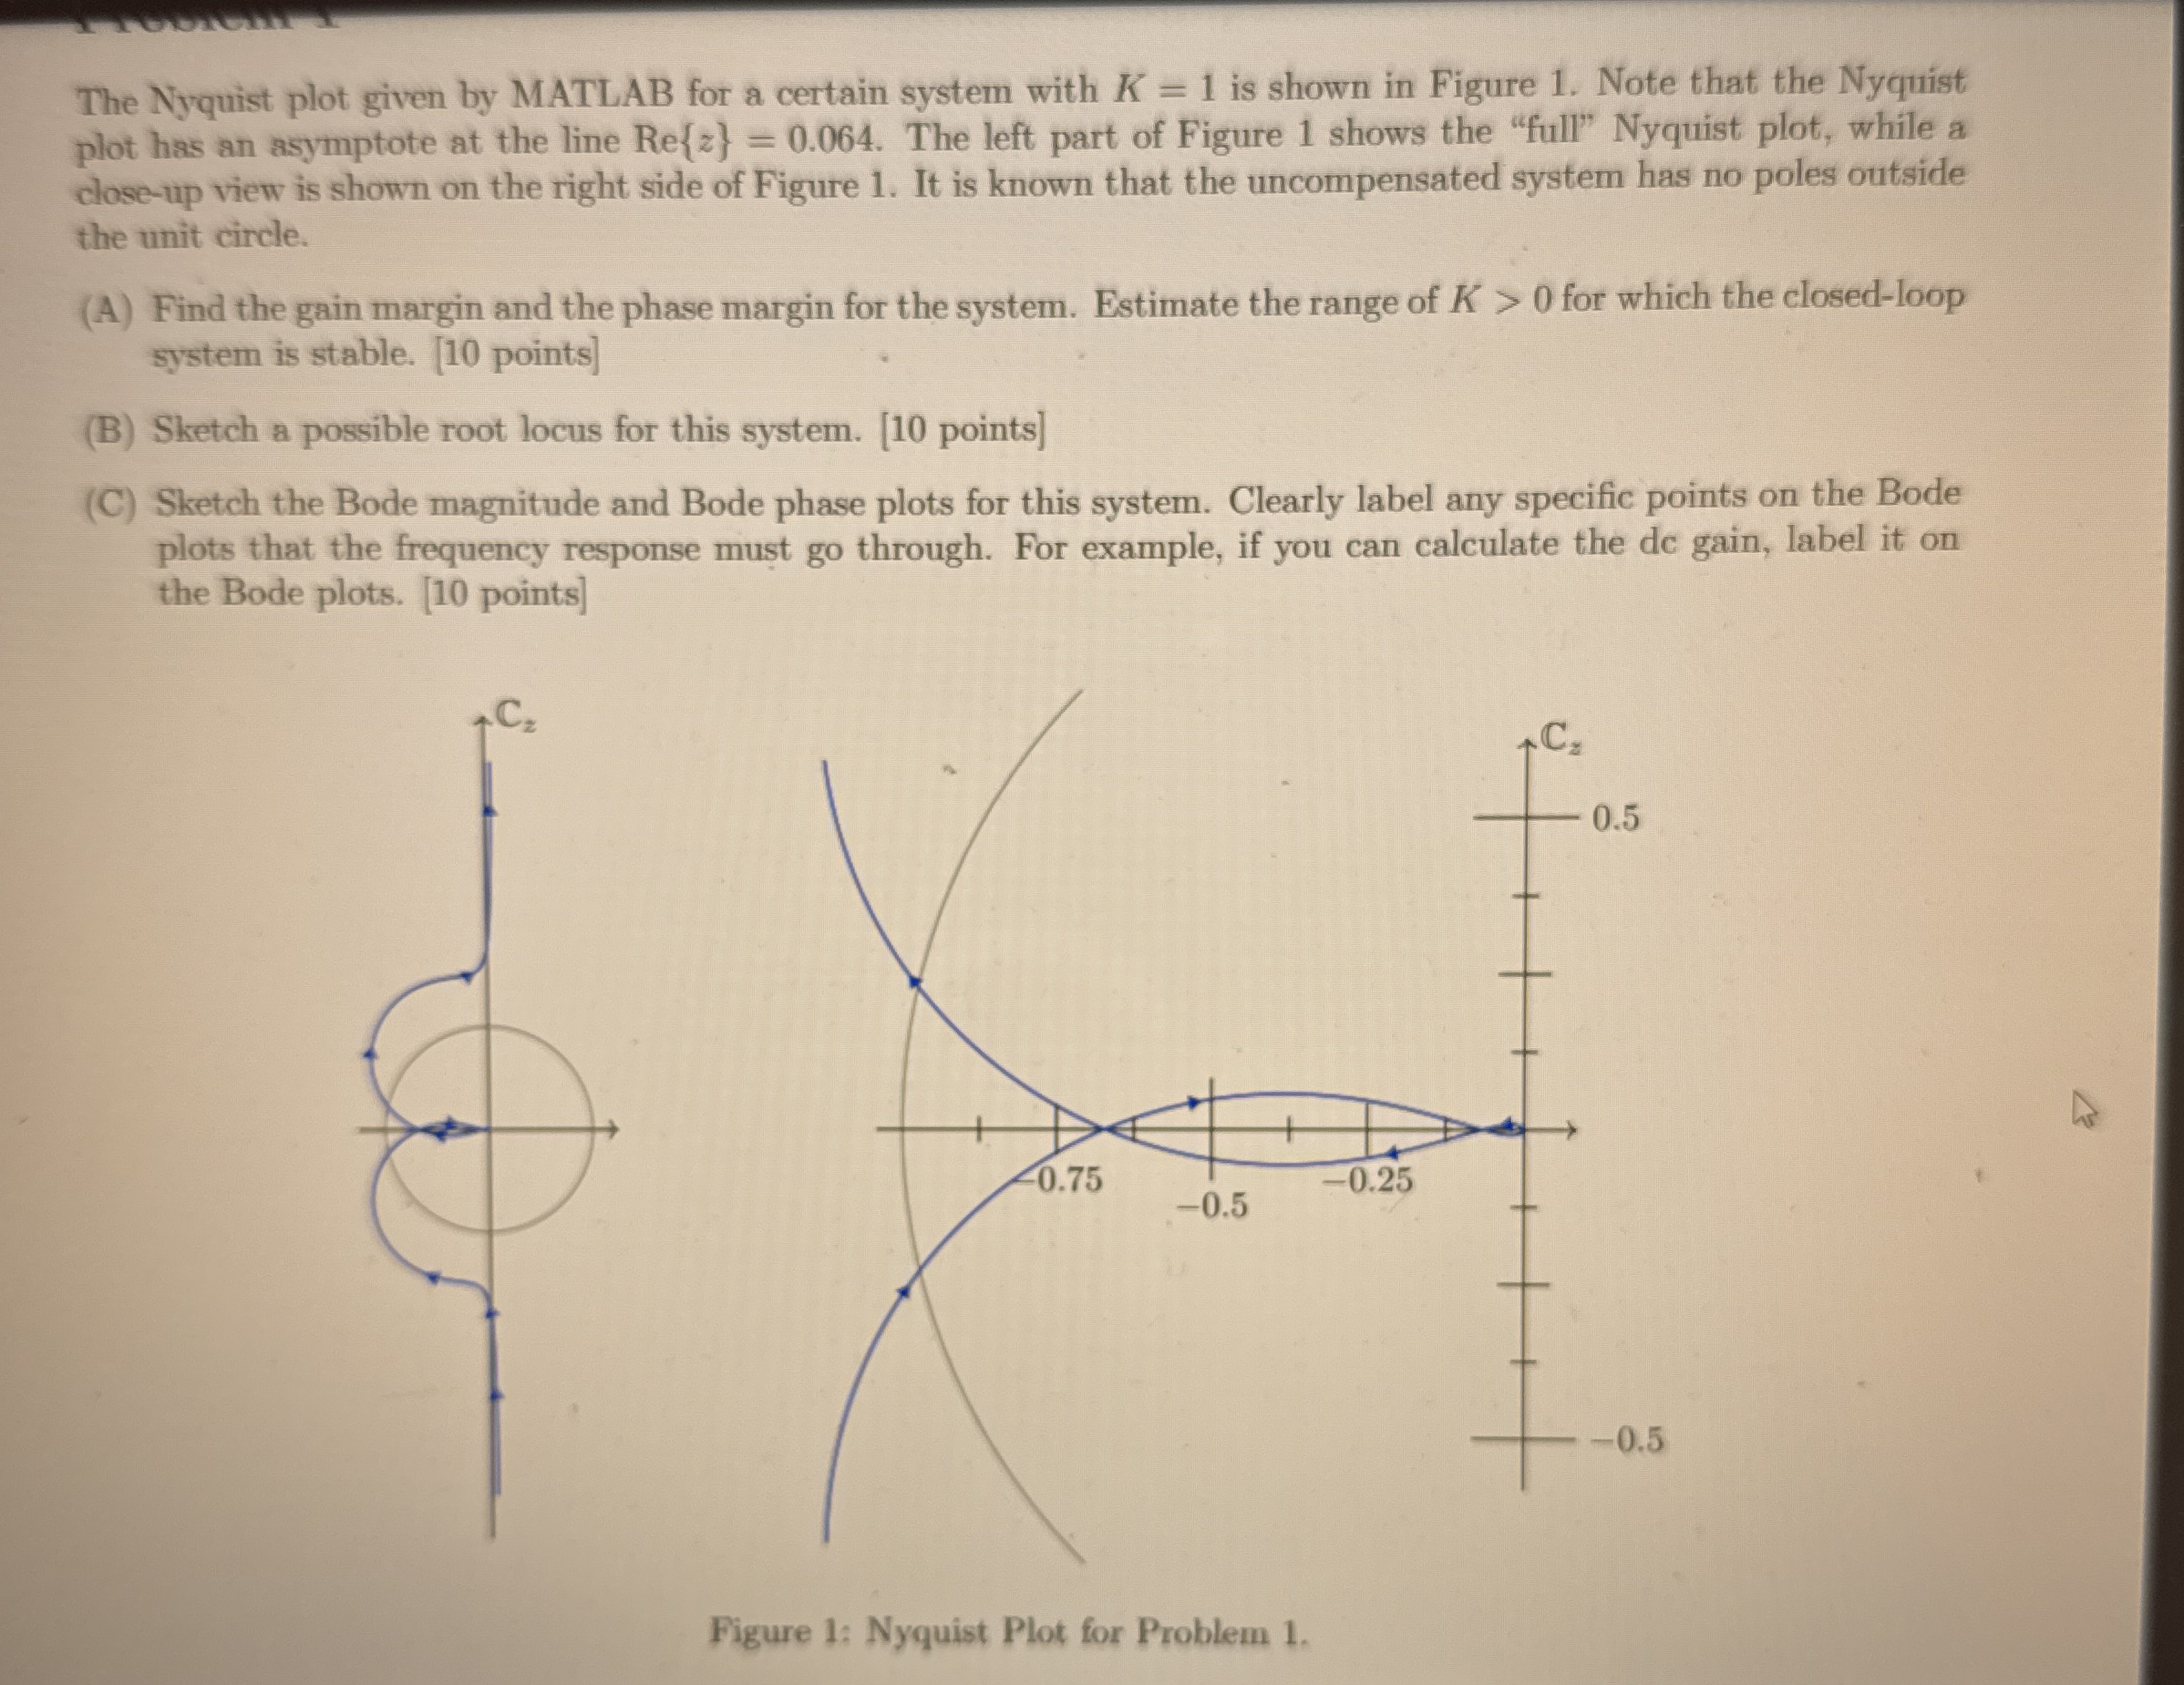
The Nyquist plot given by MATLAB for a certain system with is shown in Figure Note that the Nyquist plot has an asymptote at the line The left part of Figure shows the "full" Nyquist plot, while a closeup view is shown on the right side of Figure It is known that the uncompensated system has no poles outside the unit circle.
A Find the gain margin and the phase margin for the system. Estimate the range of for which the closedloop system is stable. points
B Sketch a possible root locus for this system. points
C Sketch the Bode magnitude and Bode phase plots for this system. Clearly label any specific points on the Bode plots that the frequency response must go through. For example, if you can calculate the de gain, label it on the Bode plots. points
Figure : Nyquist Plot for Problem
Step by Step Solution
There are 3 Steps involved in it
1 Expert Approved Answer
Step: 1 Unlock

Question Has Been Solved by an Expert!
Get step-by-step solutions from verified subject matter experts
Step: 2 Unlock
Step: 3 Unlock