

Question: The objective of this problem is to replicate and update Figures 1 to 5 below by including the last available data for each series. To
The objective of this problem is to replicate and update Figures 1 to 5 below by including the last available data for each series. To this end, you will need to access the website of the Federal Reserve Bank of St. Louis (https://fred.stlouisfed.org/ ). You must submit a single Excel file with all the figures and the relevant data used.
Follow the instructions below to construct each figure.
Figure 1.
To construct Figure 1 you need data on Real GDP and Nominal GDP.
1. Go to the website of the Federal Reserve Bank of St. Louis.
2. In the search bar, type "Real Gross Domestic Output". Choose the series Real Gross Domestic Product (GDPC1).
3. In the date range, choose January 1990 as the starting date. Choose the last available date as the ending date.
4. Click on "Edit Graph" then choose the options below.
(a) Units: "Billions of Chained 2012 Dollars"
(b) Modify Frequency: "Quarterly"
5. Next you need to add the line for nominal GDP. You can do that by choosing the "Add Line" tab within "Edit Graph".
(a) Add the series "Gross Domestic Product". That will include a second series on the graph you just produced.
6. Once you've added the second line, go to "Edit line 2" and choose the options below.
(a) Units: "Billions of Dollars"
(b) Modify Frequency: "Quarterly"
7. You have now produced the required data for your graph. Next, use the "Download" button to download the data in an Excel file. Use that data to produce the figure on Excel. Do not download the graph from FRED.
Figure 2.
You can download the necessary data for Figure 2 by repeating the previous steps and changing the "Units" option. In both cases choose "Continuously Compounded Annual Rate of Change".
Figure 3.
To construct Figure 3 you must look for data on CPI and GDP deflator. You can repeat the steps of Figure 1 with the following changes.
1. Look for the series below
(a) "Consumer Price Index for All Urban Consumers: All Items"
(b) "Gross Domestic Product: Implicit Price Deflator"
2. Change the "Units" options:
(a) Choose "Index 1982-1984=100" in the case of the Consumer Price Index.
(b) Choose "Index 2012=100" in the case of the GDP Deflator.
Figure 4.
To construct Figure 4 you must look again for data on CPI and GDP deflator and change the units. We'll choose the unit "Percentage Change from a Year Ago" to get a measure of inflation.
1. Look for the series below
(a) "Consumer Price Index for All Urban Consumers: All Items"
(b) "Gross Domestic Product: Implicit Price Deflator"
2. Change the "Units" options to "Percentage Change from a Year Ago" for both series.
Figure 5.
To construct Figure 5 you must look for data on the unemployment rate and the natural rate of unemployment. Again you can repeat the steps of Figure 1 with the following changes.
1. Look for the series below
(a) Unemployment Rate
(b) Natural Rate of Unemployment (Long Term)
2. For both series choose the Units "Percent".
3. For both series choose Modify the Frequency: "Monthly"
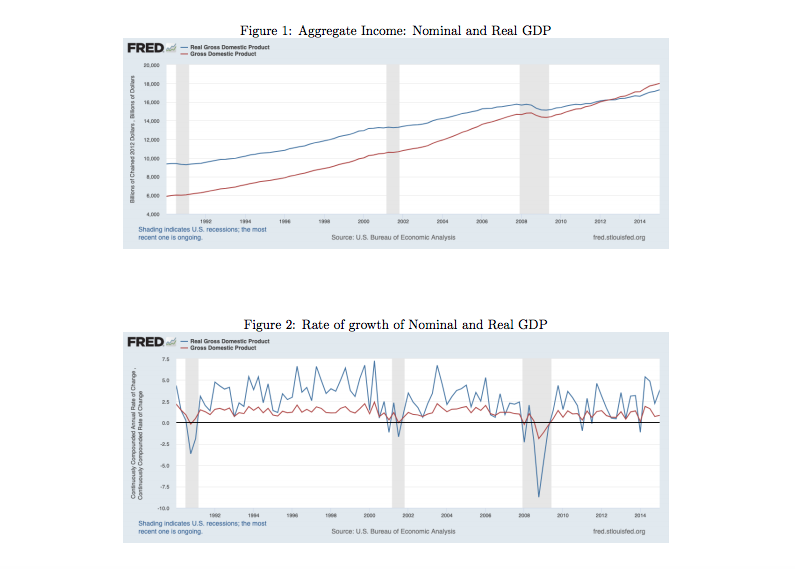
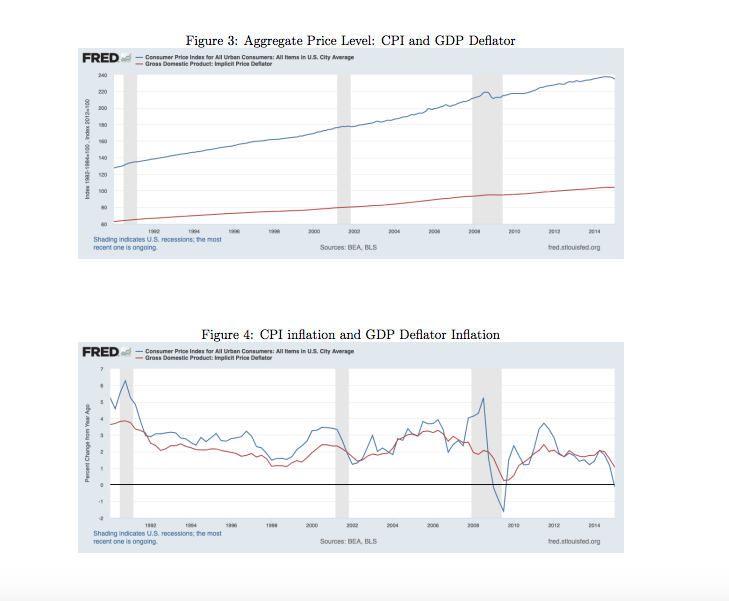
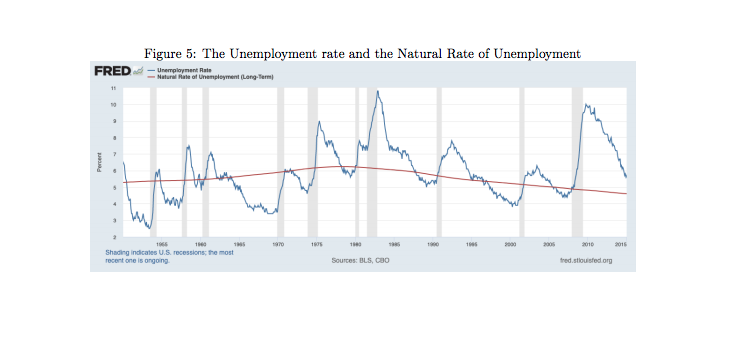
Figure 1: Aggregate Income: Nominal and Real GDP FRED - Pul Grows Domavic Product - Gross Domestic Produel 14.DO Shading indicates U.S. recessions; the most recent one is ongoing Source: U.S. Bureau of Economic Analysis Ined.stlouisfed.org Figure 2: Rate of growth of Nominal and Real GDP FRED - Aul Grows Domavic Product - Grass Domestic Product 7.5 Continuously Compounded Annual Rate at Charge Conincounty Compounded Rais of Change -25 Shading Indicates U.S. recessions; the most recent one is ongoing Source: U.S. Bureau of Economic Analysis Ined.stlouisfed.orgFigure 3: Aggregate Price Level: CPI and GDP Deflator FRED - Consumer Price Index for All Urban Consumary; All Harris In U.S. City Average - Gross Domestic Product: Implicit Price Dellater 260 Index 1982-1964-130. Irelax 9012-10 200 Shading Indicates U.S. recessions; the most recent one is ongoing Sources: DEA, ELS Ined.stlouisfed.org Figure 4: CPI inflation and GDP Deflator Inflation FRED - Consumer Price Index for Al Urban Consumers; All Fans In U.S. City Average Gross Domestic Product: Implicit Price Deflator Percent Change Tion Your App Shading Indicates U.S. recessions; the most recent one is ongoing Sources: DEA, BLS Ined.stlouisfed.orgFigure 5: The Unemployment rate and the Natural Rate of Unemployment FRED - Unemployment Rate Percent WW Shading indicates U.S. recessions; the most recent one is ongoing Sources: BLS, COO Ined.stlouisfed.org
Step by Step Solution
There are 3 Steps involved in it

Get step-by-step solutions from verified subject matter experts