Question: The only value wrong in second problem is the highlighted value 0 for Ending Inventory. Can someone help me with it. I will up vote
The only value wrong in second problem is the highlighted value 0 for Ending Inventory. Can someone help me with it. I will up vote if answer is right.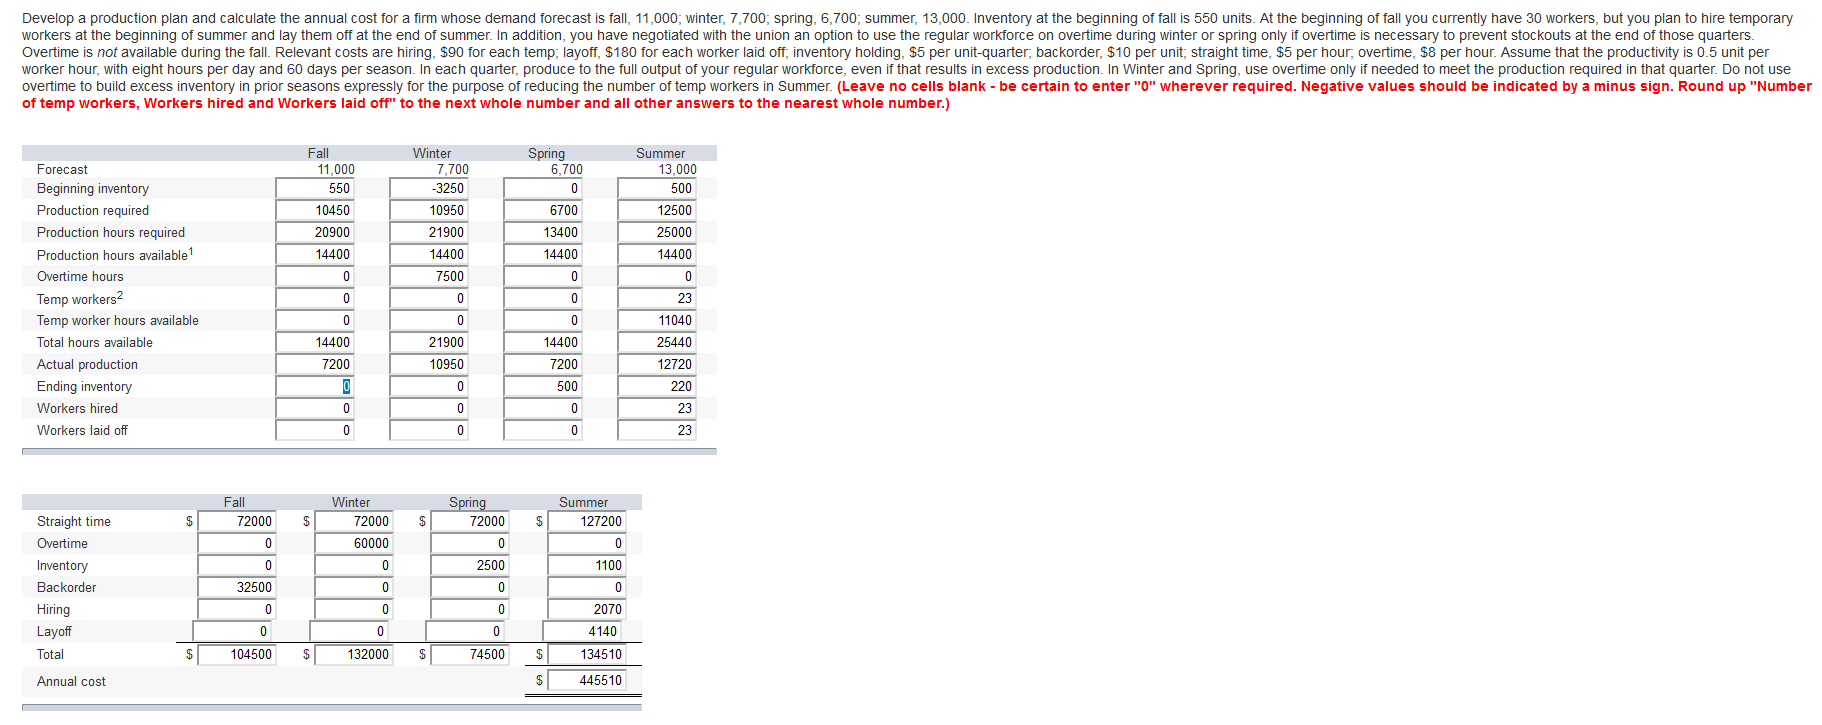
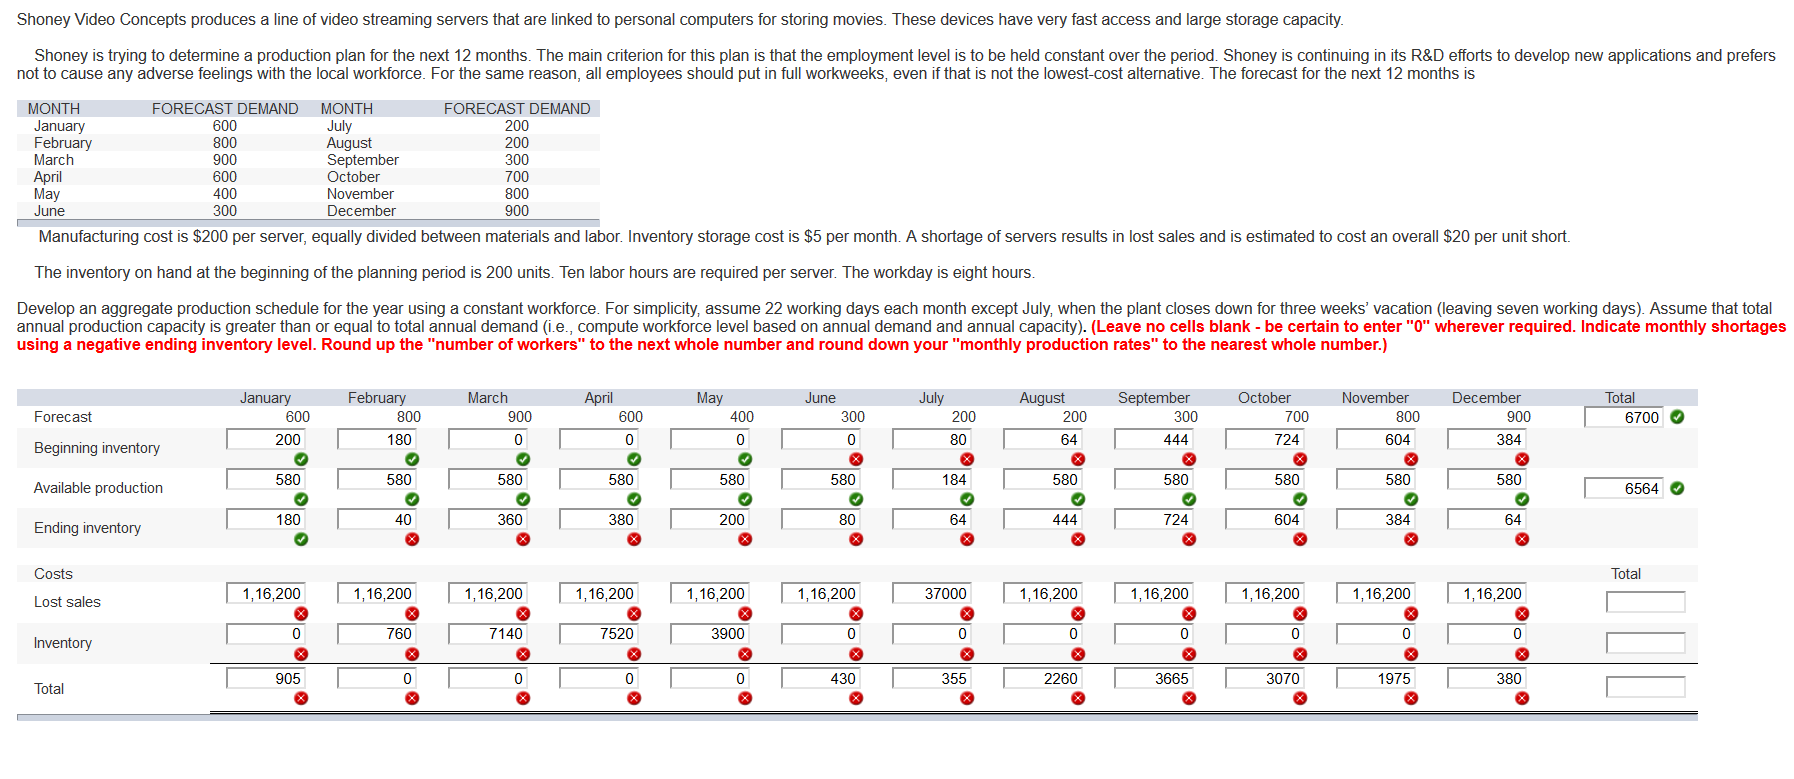
Shoney Video Concepts produces a line of video streaming servers that are linked to personal computers for storing movies. These devices have very fast access and large storage capacity. Shoney is trying to determine a production plan for the next months. The main criterion for this plan is that the employment level is to be held constant over the period. Shoney is continuing in its R&D efforts to develop new applications and prefers not to cause any adverse feelings with the local workforce. For the same reason, all employees should put in full workweeks, even if that is not the lowest-cost alternative. The forecast for the next 12 months is MONTH FORECAST DEMAND MONTH FORECAST DEMAND January 600 July 200 February 800 August 200 March 900 September 300 April 600 October 700 May 400 November 800 June 300 December 900 Manufacturing cost is $200 per server, equally divided between materials and labor. Inventory storage cost is $5 per month. A shortage of servers results in lost sales and is estimated to cost an overall $20 per unit short. The inventory on hand at the beginning of the planning period is 200 units. Ten labor hours are required per server. The workday is eight hours Develop an aggregate production schedule for the year using a constant workforce. For simplicity, assume 22 working days each month except July, when the plant closes down for three weeks' vacation (leaving seven working days). Assume that total annual production capacity is greater than or equal to total annual demand (i.e., compute workforce level based on annual demand and annual capacity). (Leave no cells blank - be certain to enter "0" wherever required. Indicate monthly shortages using a negative ending inventory level. Round up the "number of workers" to the next whole number and round down your "monthly production rates" to the nearest whole number.) March July January 600 200 February 800 180 April 600 Forecast May 400 0 August 200 June 300 0 900 Total 6700 200 October 700 724 0 0 80 September 300 444 X 580 64 November 800 604 X 580 December 900 384 X 580 Beginning inventory X 184 X 580 580 580 580 580 580 580 580 Available production 6564 180 40 360 380 200 80 64 444 724 604 384 64 Ending inventory > Costs Total 1,16,200 1,16,200 1,16,200 1,16,200 1,16,200 1,16,200 37000 1,16,200 Lost sales 1,16,200 1,16,200 1,16,200 1,16,200 760 7140 7520 3900 0 0 0 0 0 0 Inventory X x x X x x x x X 905 0 0 430 355 2260 3665 3070 1975 380 Total 0 X > 0 X X > Develop a production plan and calculate the annual cost for a firm whose demand forecast is fall, 11,000; winter, 7,700, spring, 6,700, summer, 13,000. Inventory at the beginning of fall is 550 units. At the beginning of fall you currently have 30 workers, but you plan to hire temporary workers at the beginning of summer and lay them off at the end of summer. In addition, you have negotiated with the union an option to use the regular workforce on overtime during winter or spring only if overtime is necessary to prevent stockouts at the end of those quarters. Overtime is not available during the fall. Relevant costs are hiring, $90 for each temp, layoff, $180 for each worker laid off, inventory holding, $5 per unit-quarter, backorder, $10 per unit; straight time, $5 per hour, overtime, $8 per hour. Assume that the productivity is 0.5 unit per worker hour, with eight hours per day and 60 days per season. In each quarter, produce to the full output of your regular workforce, even if that results in excess production. In Winter and Spring, use overtime only if needed to meet the production required in that quarter. Do not use overtime to build excess inventory in prior seasons expressly for the purpose of reducing the number of temp workers in Summer. (Leave no cells blank - be certain to enter "0" wherever required. Negative values should be indicated by a minus sign. Round up "Number of temp workers, Workers hired and Workers laid off" to the next whole number and all other answers to the nearest whole number.) Fall 11,000 550 10450 20900 14400 0 Winter 7,700 -3250 10950 21900 14400 7500 0 0 21900 10950 Spring 6,700 0 6700 13400 14400 Summer 13,000 500 12500 25000 14400 0 Forecast Beginning inventory Production required Production hours required Production hours available Overtime hours Temp workers 2 Temp worker hours available Total hours available Actual production Ending inventory Workers hired Workers laid off 0 0 0 0 0 14400 23 11040 25440 12720 220 23 14400 7200 500 7200 0 0 0 0 0 0 0 0 23 Fall 72000 Spring 72000 $ $ $ $ Winter 72000 60000 0 Summer 127200 0 1100 0 0 2500 Straight time Overtime Inventory Backorder Hiring Layoff Total 0 0 32500 0 0 0 0 0 0 0 2070 4140 0 0 0 74500 $ 104500 132000 $ $ 134510 Annual cost $ 445510


