

Question: The optimal tableau is given in Table 1. .. * C. 1 1 50 1 0 03 0 0 1 X3 X 22 0
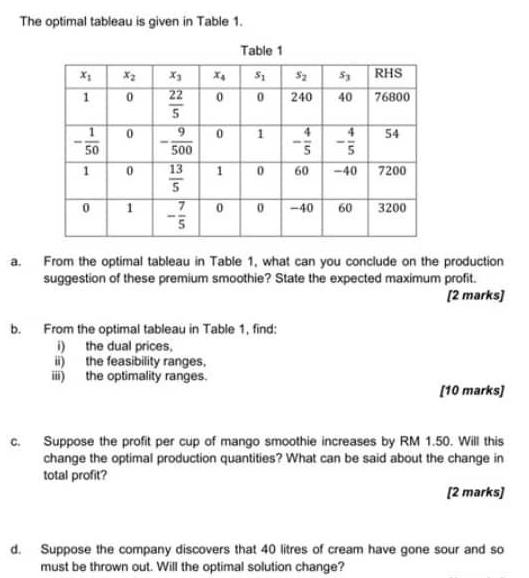
The optimal tableau is given in Table 1. .. * C. 1 1 50 1 0 03 0 0 1 X3 X 22 0 5 9 500 13 5 7 0 1 0 Table 1 S1 0 1 0 5 240 b. From the optimal tableau in Table 1, find: i) the dual prices, ii) the feasibility ranges, iii) the optimality ranges. 4 60 53 40 wit -40 0 -40 60 RHS 76800 54 7200 3200 From the optimal tableau in Table 1, what can you conclude on the production suggestion of these premium smoothie? State the expected maximum profit. [2 marks] [10 marks] Suppose the profit per cup of mango smoothie increases by RM 1.50. Will this change the optimal production quantities? What can be said about the change in total profit? [2 marks] d. Suppose the company discovers that 40 litres of cream have gone sour and so must be thrown out. Will the optimal solution change?
Step by Step Solution
3.48 Rating (151 Votes )
There are 3 Steps involved in it
From the optimal tableau in Table 1 it can be concluded that the c... View full answer

Get step-by-step solutions from verified subject matter experts