

Question: The optimistic, most likely, and pessimistic estimates for a certain investment project are as shown in the accompanying table. MARR = 0.1. Optimistic Most Likely
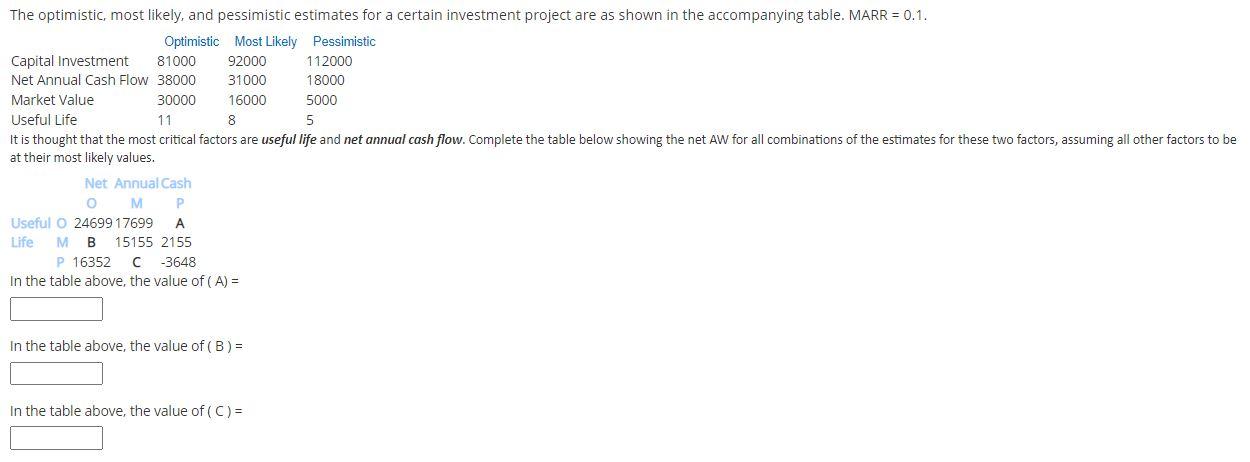
The optimistic, most likely, and pessimistic estimates for a certain investment project are as shown in the accompanying table. MARR = 0.1. Optimistic Most Likely Pessimistic Capital Investment 81000 92000 112000 Net Annual Cash Flow 38000 31000 18000 Market Value 30000 16000 5000 Useful Life 11 8 5 It is thought that the most critical factors are useful life and net annual cash flow. Complete the table below showing the net AW for all combinations of the estimates for these two factors, assuming all other factors to be at their most likely values. Net Annual Cash o M P Useful O 24699 17699 A Life MB 15155 2155 P 16352 C -3648 In the table above, the value of (A) = In the table above, the value of (B) = In the table above, the value of (C)=
Step by Step Solution
There are 3 Steps involved in it

Get step-by-step solutions from verified subject matter experts