

Question: The original scatterplot of y vs. x looks like this: The slope ot a simple near regression une ror these points is 0 . a)
The original scatterplot of
yvs.
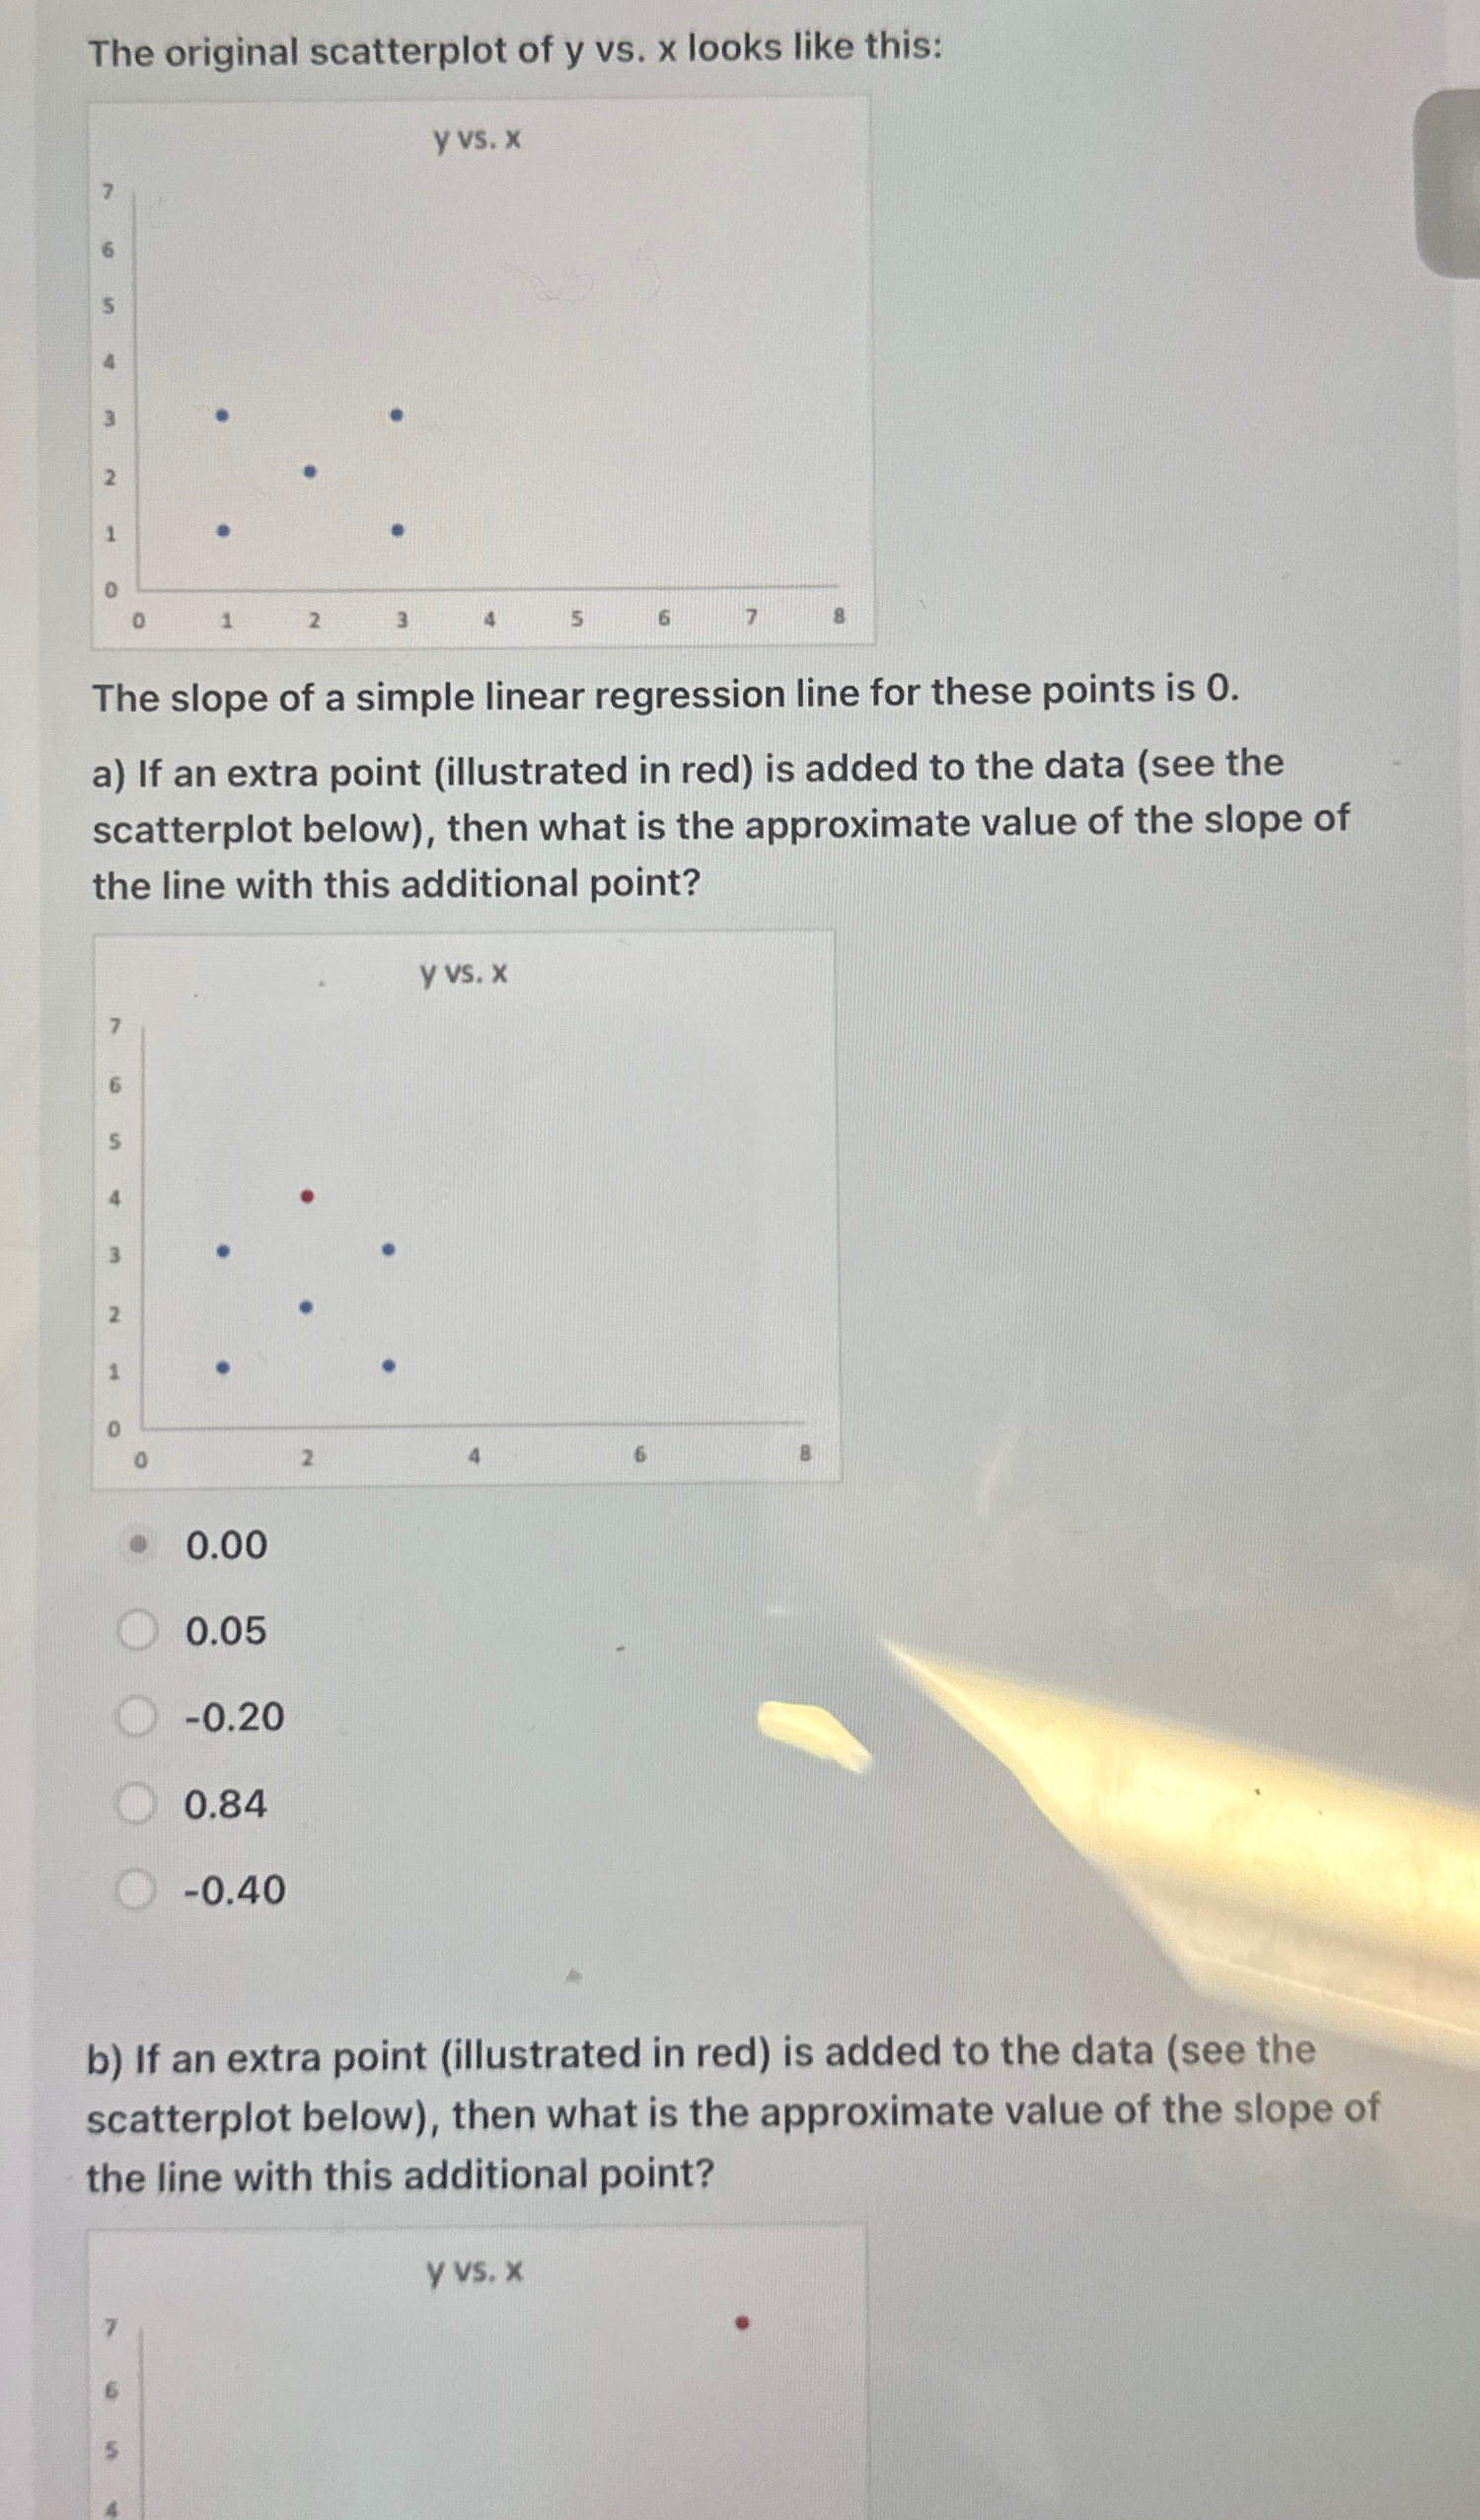
xlooks like this:\ The slope ot a simple near regression une ror these points is 0 .\ a) If an extra point (illustrated in red) is added to the data (see the scatterplot below), then what is the approximate value of the slope of the line with this additional point?\ 0.00\ 0.05\
-0.20\ 0.84\
-0.40\ b) If an extra point (illustrated in red) is added to the data (see the scatterplot below), then what is the approximate value of the slope of the line with this additional point?
The original scatterplot of y vs. x looks like this: The slope of a simple linear regression line for these points is 0. a) If an extra point (illustrated in red) is added to the data (see the scatterplot below), then what is the approximate value of the slope of the line with this additional point? 0.00 0.05 0.20 0.84 0.40 b) If an extra point (illustrated in red) is added to the data (see the scatterplot below), then what is the approximate value of the slope of the line with this additional point
Step by Step Solution
There are 3 Steps involved in it

Get step-by-step solutions from verified subject matter experts