

Question: The output below is for a t-test for the hypothesis: Individuals living in bad neighborhoods commit more crime than those living in good neighborhoods. The
The output below is for a t-test for the hypothesis: Individuals living in bad neighborhoods commit more crime than those living in good neighborhoods. The data in the Group Statistics section provides you with the average number of crimes committed by individuals living in good and bad neighborhoods and the standard deviation of this same variable. The findings of significance are located in the Independent Samples Test section. Pay particular attention to the "t" column and the "Sig (2-tailed)"column. The "t" column is the t value that you would have calculated by hand (as we learned in class). The "Sig (2-tailed)"column provides you with the p value (the level of significance of this relationship). In this column, any value below .05 indicates that you would have rejected your null hypothesis.
Can someone tell me about the relationship of all these data? I'm trying to determine if my hypothesis, listed below, can be proven or disproven? What is the independent variable and dependent variable? Identify the level of measurement of each variable. You must indicate whether each variable is: (A) Nominal, (B) Ordinal, or (C)Interval/Ratio? And Which four tests should I be using and to solve it (A) t-test, (B) Chi-Square, (C) Analysis of Variance, or (D) Correlation Coefficient?
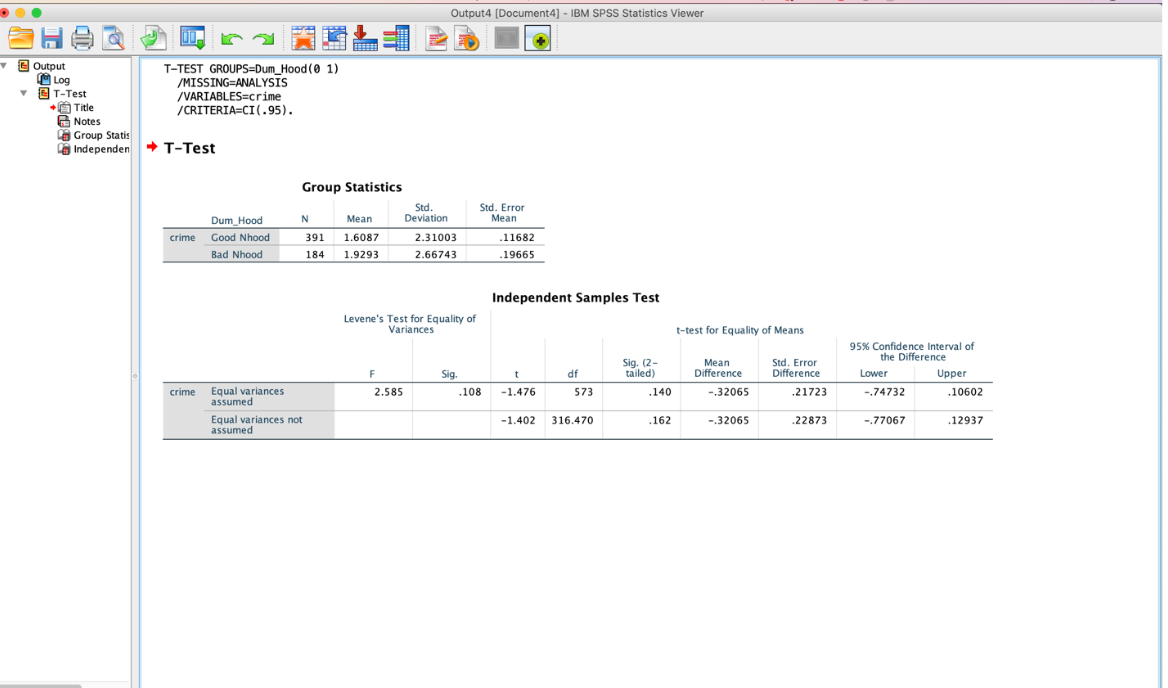
. . . Output4 [Document4] - IBM SPSS Statistics Viewer E Output Log T-TEST GROUPS=Dum_Hood (0 1) T-Test /MISSING=ANALYSIS Title /VARIABLES=crime Notes /CRITERIA=CI(.95) . Group Statis Independen + T-Test Group Statistics Std. Std. Error Dum_Hood N Mean Deviation Mean crime Good Nhood 391 1.6087 2.31003 11682 Bad Nhood 184 1.9293 2.66743 19665 Independent Samples Test Levene's Test for Equality of Variances t-test for Equality of Means 95% Confidence Interval of Sig. (2- Mean Std. Error the Difference Sig df tailed) Difference Difference Lower Upper crime Equal variances 2.585 108 -1.476 573 140 -.32065 21723 .74732 10602 assumed Equal variances not -1.402 316.470 162 -.32065 .22873 -.77067 .12937 assumed
Step by Step Solution
There are 3 Steps involved in it

Get step-by-step solutions from verified subject matter experts