

Question: The photo attached is a relationship between index return and return on each of the two stocks using monthly data. Comment on the results of
The photo attached is a relationship between index return and return on each of the two stocks using monthly data.
- Comment on the results of the regressions, significance of the estimates, goodness of fit of the models.
- Interpret the alpha and beta coefficients from CAPM perspective, what do these variables mean, how do the risk of these securities mean when compared to the risk of the market portfolio.
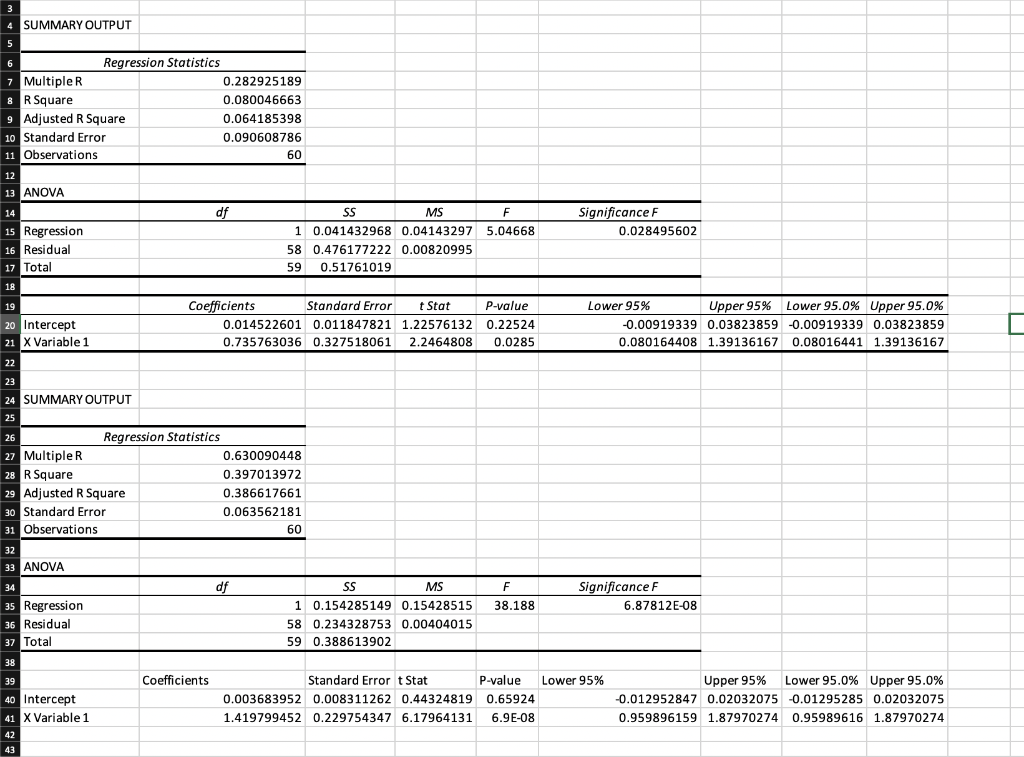
SUMMARY OUTPUT 5 6 Regression Statistics 7 Multiple 0.282925189 & R Square 0.080046663 9 Adjusted R Square 0.064185398 10 Standard Error 0.090608786 11 Observations 60 12 13 ANOVA 14 df SS MS F 15 Regression 1 0.041432968 0.04143297 5.04668 16 Residual 58 0.476177222 0.00820995 17 Total 59 0.51761019 Significance F 0.028495602 18 19 20 Intercept 21 X Variable 1 Coefficients Standard Error t Stat P-value 0.014522601 0.011847821 1.22576132 0.22524 0.735763036 0.327518061 2.2464808 0.0285 Lower 95% Upper 95% Lower 95.0% Upper 95.0% -0.00919339 0.03823859 -0.00919339 0.03823859 0.080164408 1.39136167 0.08016441 1.39136167 22 23 24 SUMMARY OUTPUT 25 26 Regression Statistics 27 Multiple 0.630090448 28 R Square 0.397013972 29 Adjusted R Square 0.386617661 30 Standard Error 0.063562181 31 Observations 60 32 33 ANOVA 34 df SS MS F Significance F 6.87812E-08 38.188 35 Regression 36 Residual 37 Total 1 0.154285149 0.15428515 58 0.234328753 0.00404015 59 0.388613902 38 39 Coefficients 40 Intercept 41 X Variable 1 Standard Error t Stat P-value Lower 95% 0.003683952 0.008311262 0.44324819 0.65924 1.419799452 0.229754347 6.17964131 6.9E-08 Upper 95% Lower 95.0% Upper 95.0% -0.012952847 0.02032075 -0.01295285 0.02032075 0.959896159 1.87970274 0.95989616 1.87970274 42 43 SUMMARY OUTPUT 5 6 Regression Statistics 7 Multiple 0.282925189 & R Square 0.080046663 9 Adjusted R Square 0.064185398 10 Standard Error 0.090608786 11 Observations 60 12 13 ANOVA 14 df SS MS F 15 Regression 1 0.041432968 0.04143297 5.04668 16 Residual 58 0.476177222 0.00820995 17 Total 59 0.51761019 Significance F 0.028495602 18 19 20 Intercept 21 X Variable 1 Coefficients Standard Error t Stat P-value 0.014522601 0.011847821 1.22576132 0.22524 0.735763036 0.327518061 2.2464808 0.0285 Lower 95% Upper 95% Lower 95.0% Upper 95.0% -0.00919339 0.03823859 -0.00919339 0.03823859 0.080164408 1.39136167 0.08016441 1.39136167 22 23 24 SUMMARY OUTPUT 25 26 Regression Statistics 27 Multiple 0.630090448 28 R Square 0.397013972 29 Adjusted R Square 0.386617661 30 Standard Error 0.063562181 31 Observations 60 32 33 ANOVA 34 df SS MS F Significance F 6.87812E-08 38.188 35 Regression 36 Residual 37 Total 1 0.154285149 0.15428515 58 0.234328753 0.00404015 59 0.388613902 38 39 Coefficients 40 Intercept 41 X Variable 1 Standard Error t Stat P-value Lower 95% 0.003683952 0.008311262 0.44324819 0.65924 1.419799452 0.229754347 6.17964131 6.9E-08 Upper 95% Lower 95.0% Upper 95.0% -0.012952847 0.02032075 -0.01295285 0.02032075 0.959896159 1.87970274 0.95989616 1.87970274 42 43
Step by Step Solution
There are 3 Steps involved in it

Get step-by-step solutions from verified subject matter experts