

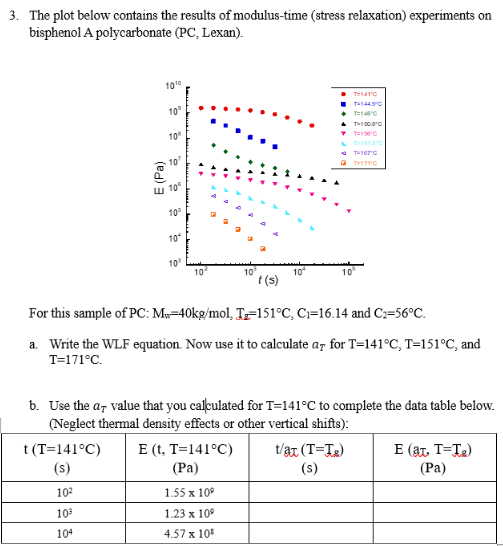
Question: The plot below contains the results of modulus - time ( stress relaxation ) experiments on bisphenol A polycarbonate ( PC , Lexan ) .
The plot below contains the results of modulustime stress relaxation experiments on
bisphenol A polycarbonate PC Lexan
For this sample of PC: and
a Write the WLF equation. Now use it to calculate for and
b Use the value that you calculated for to complete the data table below.
Neglect thermal density effects or other vertical shifts: c Sketch a master curve that includes several at least of the data sets. Disregard vertical shifts. Be sure to clearly distinguish the different data sets and include values and labels on the axes. Don't worry about plotting each data point perfectly, just illustrate the general trends clearly.
d Show how you expect the results of your experiment to change if the molecular weight of the polymer is tripled. Draw your hypothesis on the master curve above and label it Please give me the answers and procedure
Step by Step Solution
There are 3 Steps involved in it
1 Expert Approved Answer
Step: 1 Unlock

Question Has Been Solved by an Expert!
Get step-by-step solutions from verified subject matter experts
Step: 2 Unlock
Step: 3 Unlock