

Question: The plot below is called an indicator diagram and it describes a thermodynamic process. The gas starts in state 1, undergoes a constant volume decrease
The plot below is called an indicator diagram and it describes a thermodynamic process.\ The gas starts in state 1, undergoes a constant volume decrease in pressure until it is in state 2 , then the gas is expanded at constant pressure until is in state 3 . Lastly, the gas in compressed at constant temperature until it goes back to state 1 .\ The system contains
0.0250molof a monatomic ideal gas undergoing the process shown in the indicfitor diagram.\ What is the temperature for step
cof this cycle?
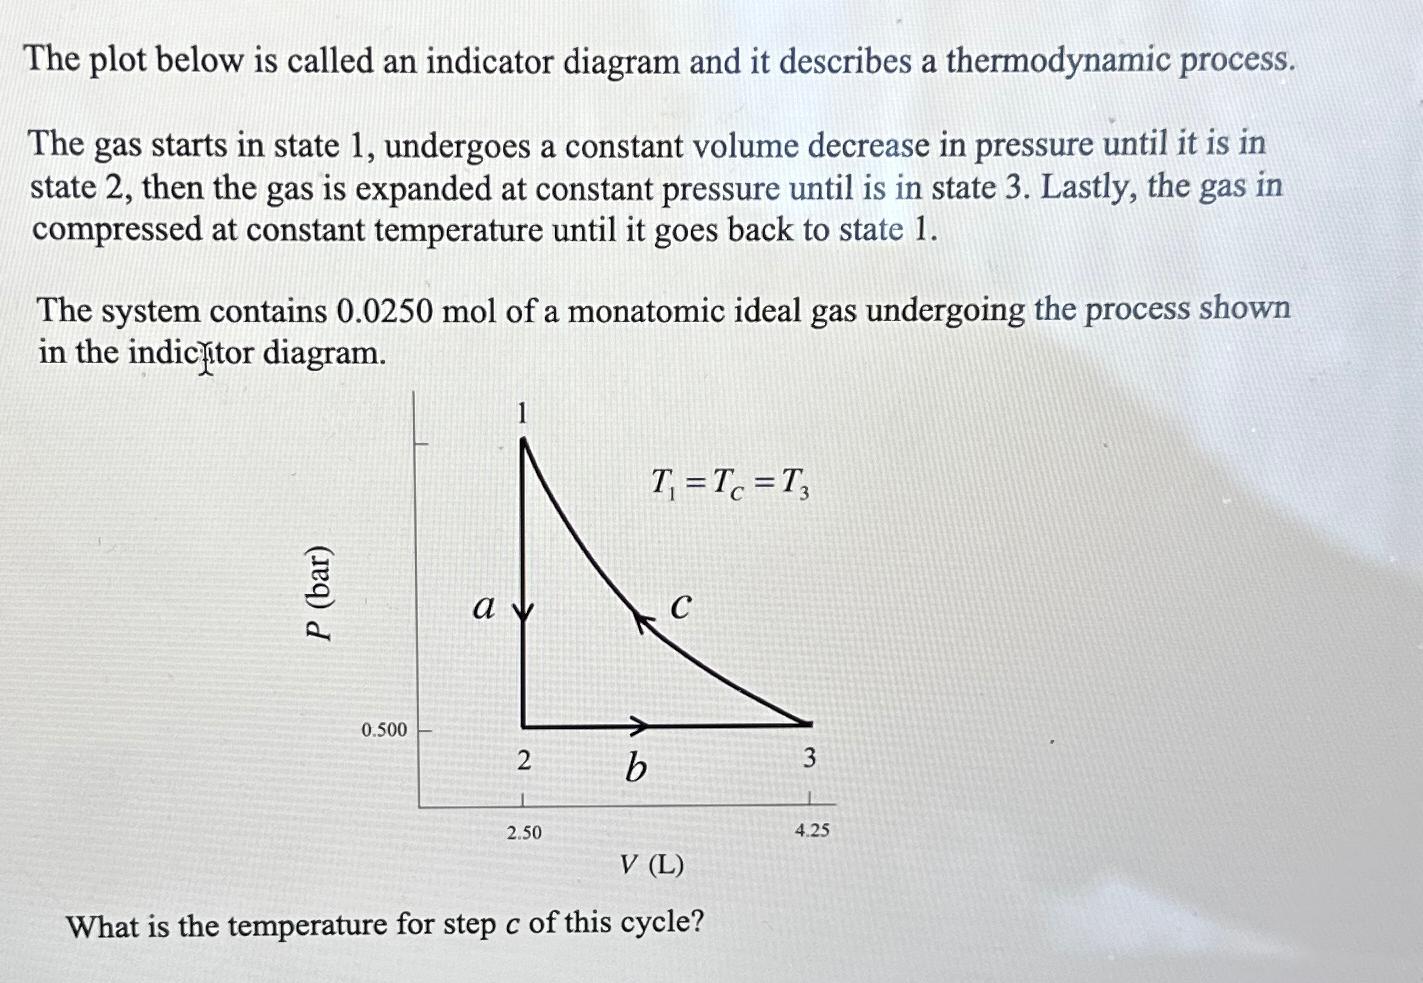
The plot below is called an indicator diagram and it describes a thermodynamic process. The gas starts in state 1 , undergoes a constant volume decrease in pressure until it is in state 2 , then the gas is expanded at constant pressure until is in state 3 . Lastly, the gas in compressed at constant temperature until it goes back to state 1 . The system contains 0.0250mol of a monatomic ideal gas undergoing the process shown in the indicitor diagram. What is the temperature for step c of this cycle
Step by Step Solution
There are 3 Steps involved in it

Get step-by-step solutions from verified subject matter experts