

Question: The plot below shows the investment frontier that can be created using stocks (green square) and corporate bonds (red circle). The 100% stock portfolio is
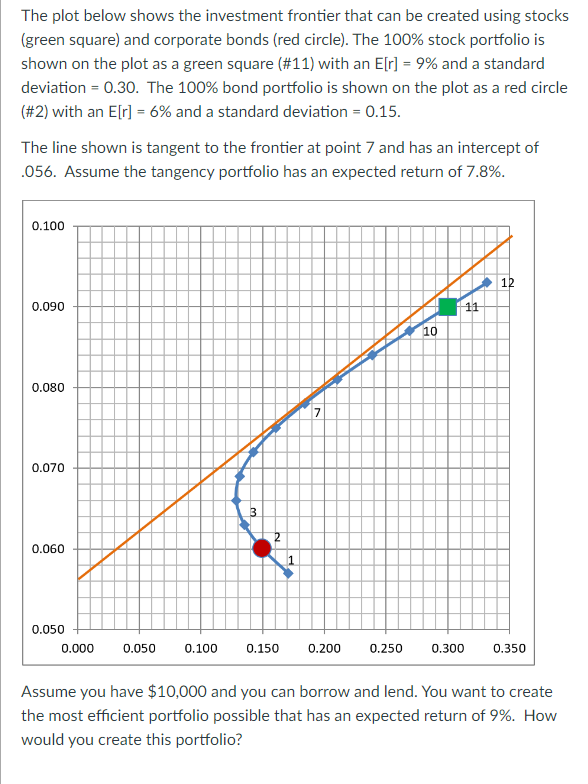
The plot below shows the investment frontier that can be created using stocks (green square) and corporate bonds (red circle). The 100% stock portfolio is shown on the plot as a green square (\#11) with an E[r]=9% and a standard deviation =0.30. The 100% bond portfolio is shown on the plot as a red circle (#2) with an E[r]=6% and a standard deviation =0.15. The line shown is tangent to the frontier at point 7 and has an intercept of .056. Assume the tangency portfolio has an expected return of 7.8%. Assume you have $IU,U and you can borrow and lend. You want to create the most efficient portfolio possible that has an expected return of 9%. How would you create this portfolio
Step by Step Solution
There are 3 Steps involved in it

Get step-by-step solutions from verified subject matter experts