

Question: The plot in (c) is decidedly unappealing for a number of reasons. Produce a more realistic depiction of the volcano as per the following:
The plot in (c) is decidedly unappealing for a number of reasons. Produce a more realistic depiction of the volcano as per the following:
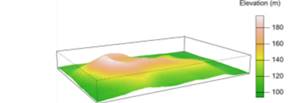
– Use a new graphics device with the margin widths reset to one, one, one, and four lines on the bottom, left, top, and right, respectively.
– The help file ?volcano reveals the x- and y-coordinates to which the volcano z-matrix corresponds is in 10-meter units. Using scale and altering expand, replot the surface with the correct aspect ratio in all three axes.
– Suppress all axis tick marks and notation using axes.
– The facets should be colored according to 50 colors generated from the built-in terrain.colors palette, and the facet border lines should be suppressed.
– Find your choice of visually appealing viewing angle.
– Use colorlegend from the shape package to place a color legend referencing elevation in meters in the space to the right of the plot. Experiment with the arguments to find appropriate placement and tick mark labels.
Here’s my version of the improved plot:
you looked at the spatial distribution of intentionally lit fires in a region of Spain. Ensure the spatstat package is loaded, and then rerun the following lines to obtain the relevant data objects:
Elevation (m) 180 160 140 100
Step by Step Solution
There are 3 Steps involved in it
QUESTION The plot in c is decidedly unappealing for a number of reasons Produce a more realistic depiction of the volcano as per the following Use a n... View full answer

Get step-by-step solutions from verified subject matter experts