

Question: The plot of 50 data points from a time series {Y_t} (original and log-transformed) is shown here. 1. The plot of 50 data points from
The plot of 50 data points from a time series {Y_t} (original and log-transformed) is shown here.
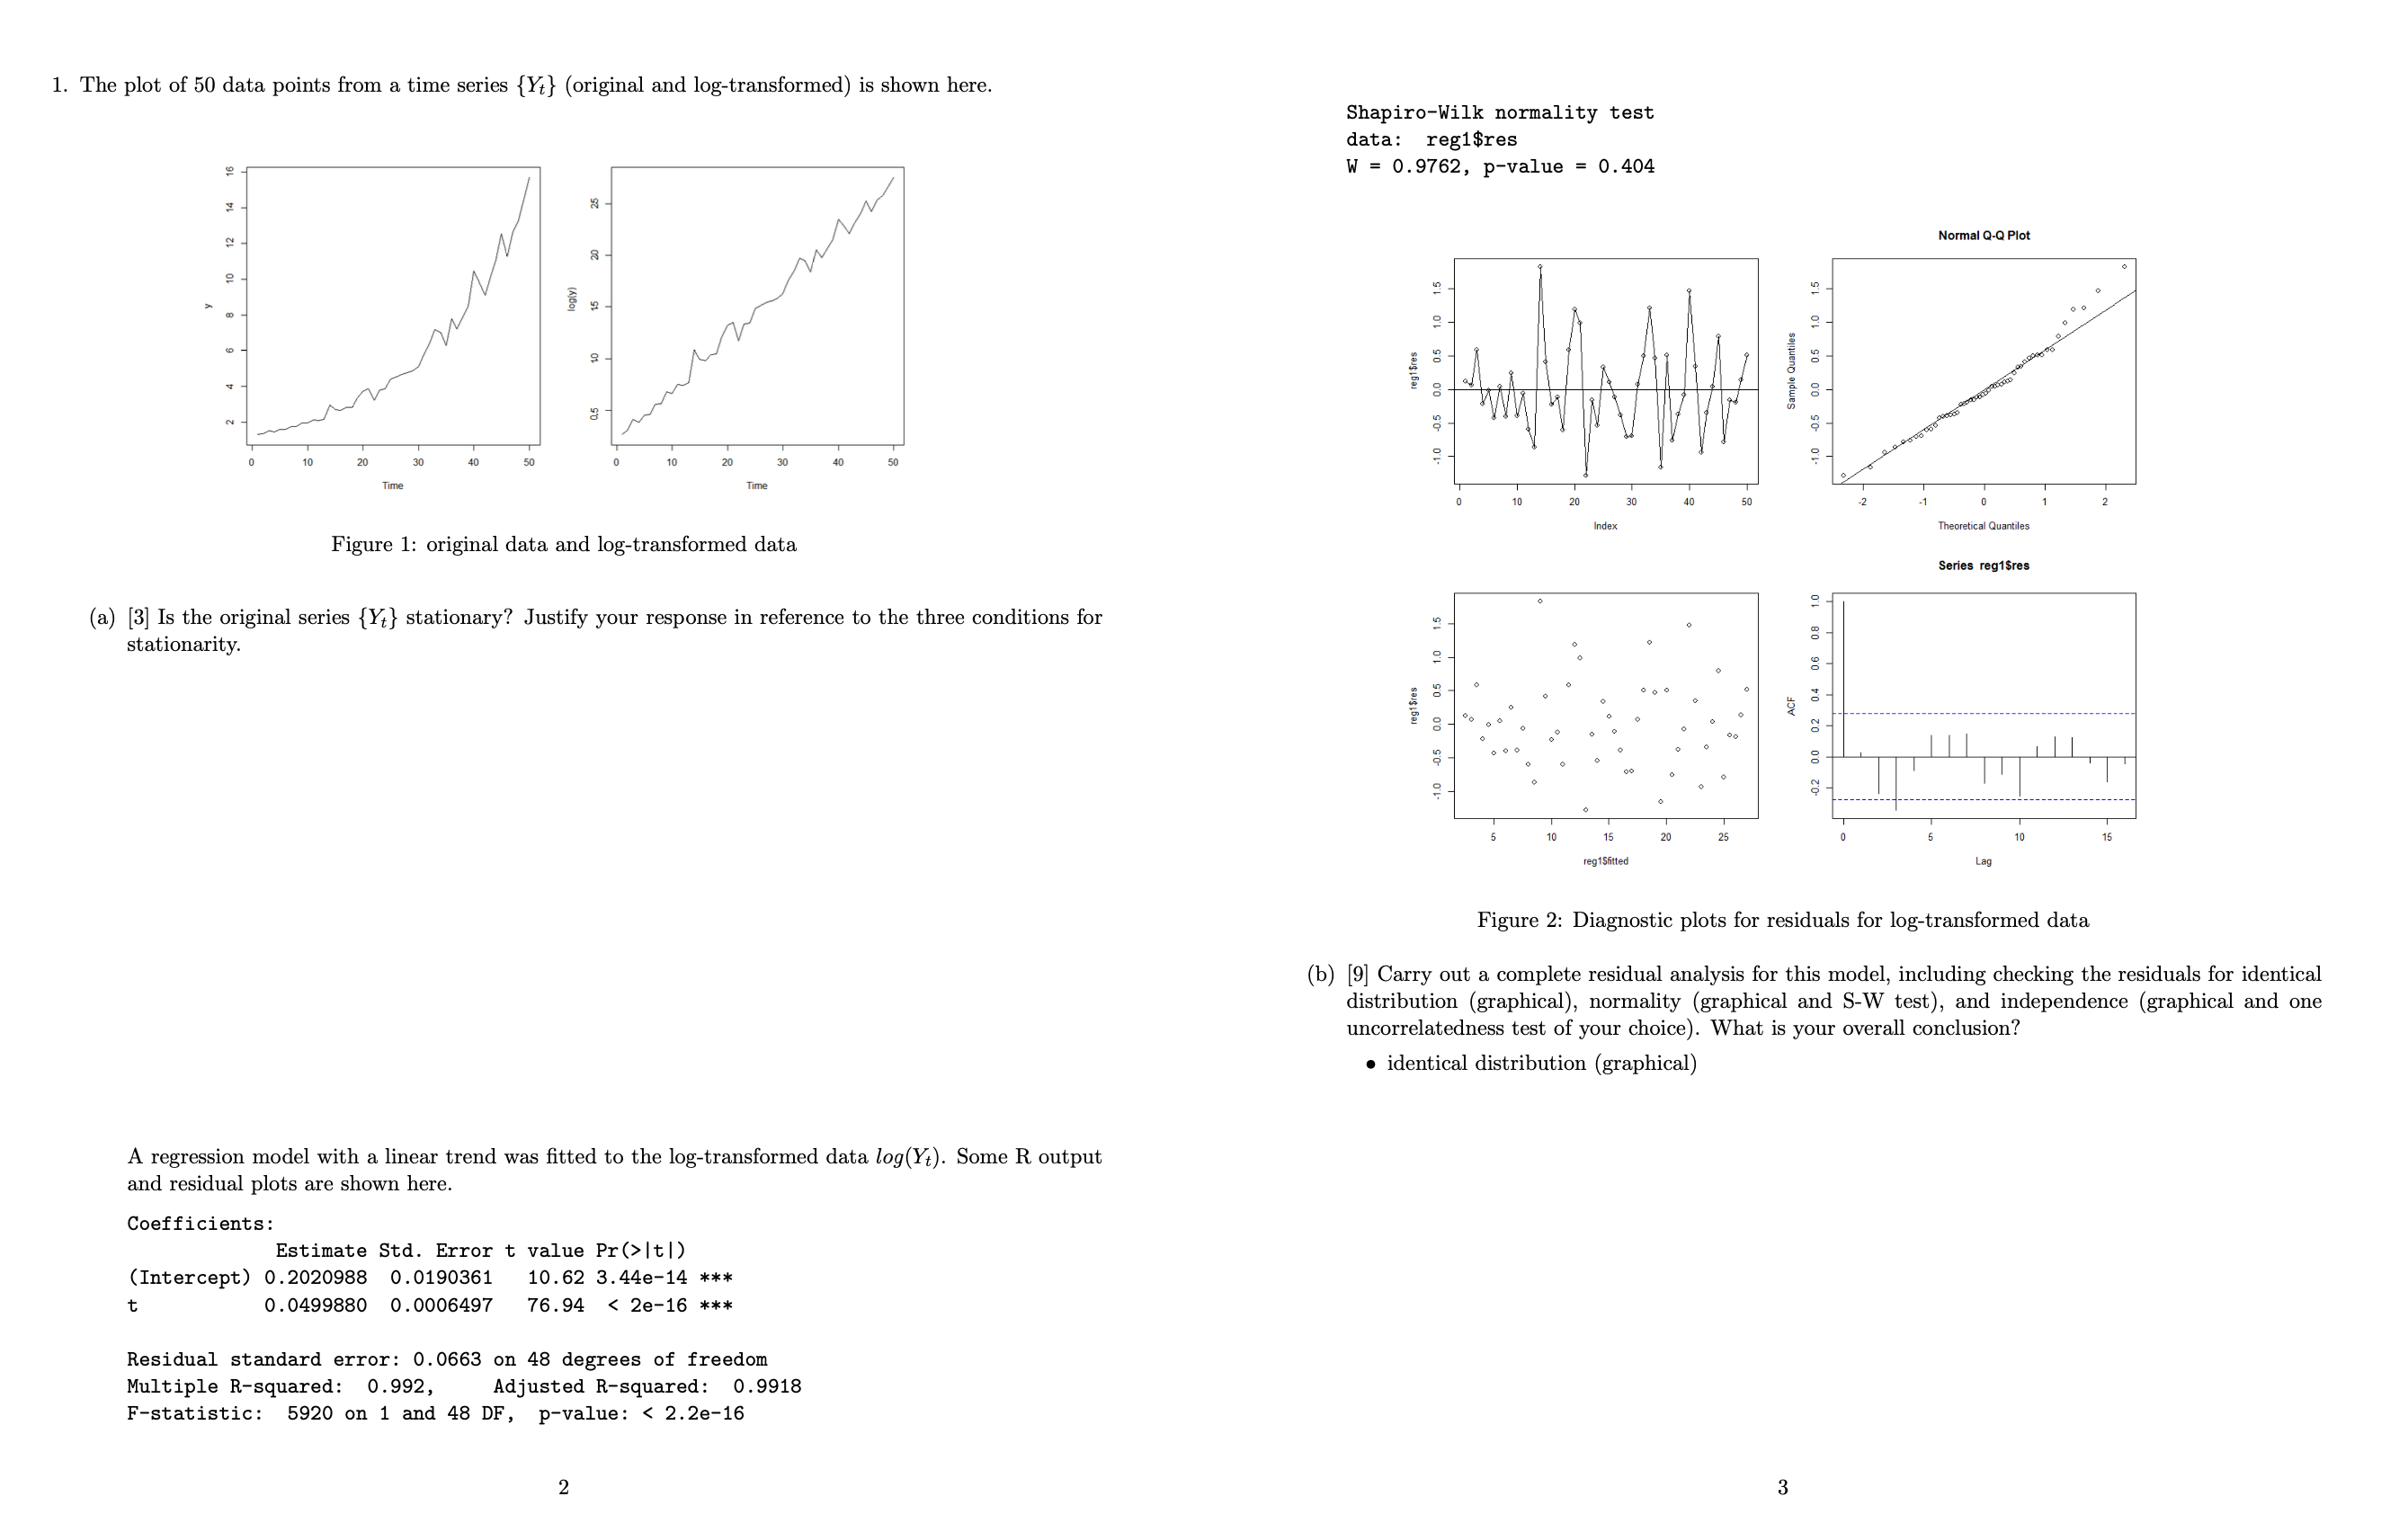
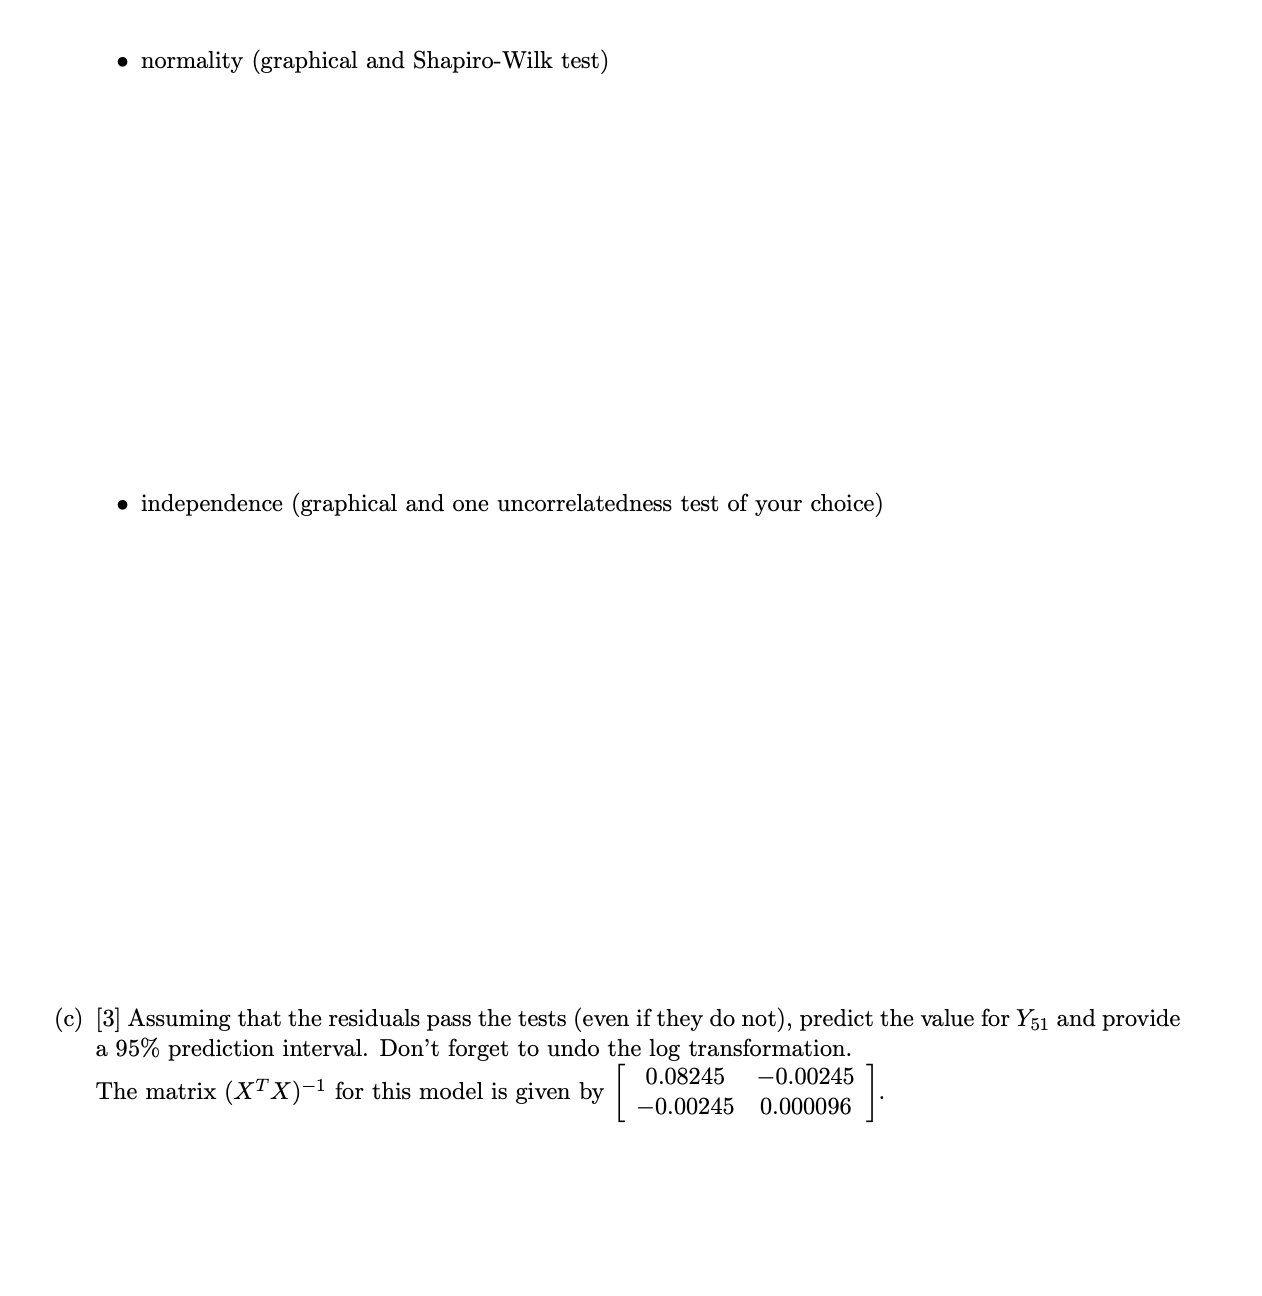
1. The plot of 50 data points from a time series {Yt} (original and log-transformed) is shown here. Shapiro-Wilk normality test data: reg1$re W = 0.9762, p-value = 0. 404 Normal Q-Q Plot 8 regisres -1.0 0.5 0.0 0.5 1.0 1.5 Sample Quantiles -1.0 0.5 0.0 0.5 1.0 1.5 10 40 50 Index Figure 1: original data and log-transformed data Theoretical Quantiles Series reg1$res (a) [3] Is the original series {Y} stationary? Justify your response in reference to the three conditions for stationarity. reg1 $res -1.0 0.5 0.0 0.5 1.0 1.5 20.0 0.2 0.4 0.6 0.8 1.0 reg1Sfitted Figure 2: Diagnostic plots for residuals for log-transformed data (b) [9] Carry out a complete residual analysis for this model, including checking the residuals for identical distribution (graphical), normality (graphical and S-W test), and independence (graphical and one uncorrelatedness test of your choice). What is your overall conclusion? . identical distribution (graphical) A regression model with a linear trend was fitted to the log-transformed data log(Yt). Some R output and residual plots are shown here. Coefficients: Estimate Std. Error t value Pr(> |t/) (Intercept) 0.2020988 0.0190361 10. 62 3. 44e-14 *** t 0. 0499880 0. 0006497 76.94
Step by Step Solution
There are 3 Steps involved in it

Get step-by-step solutions from verified subject matter experts