

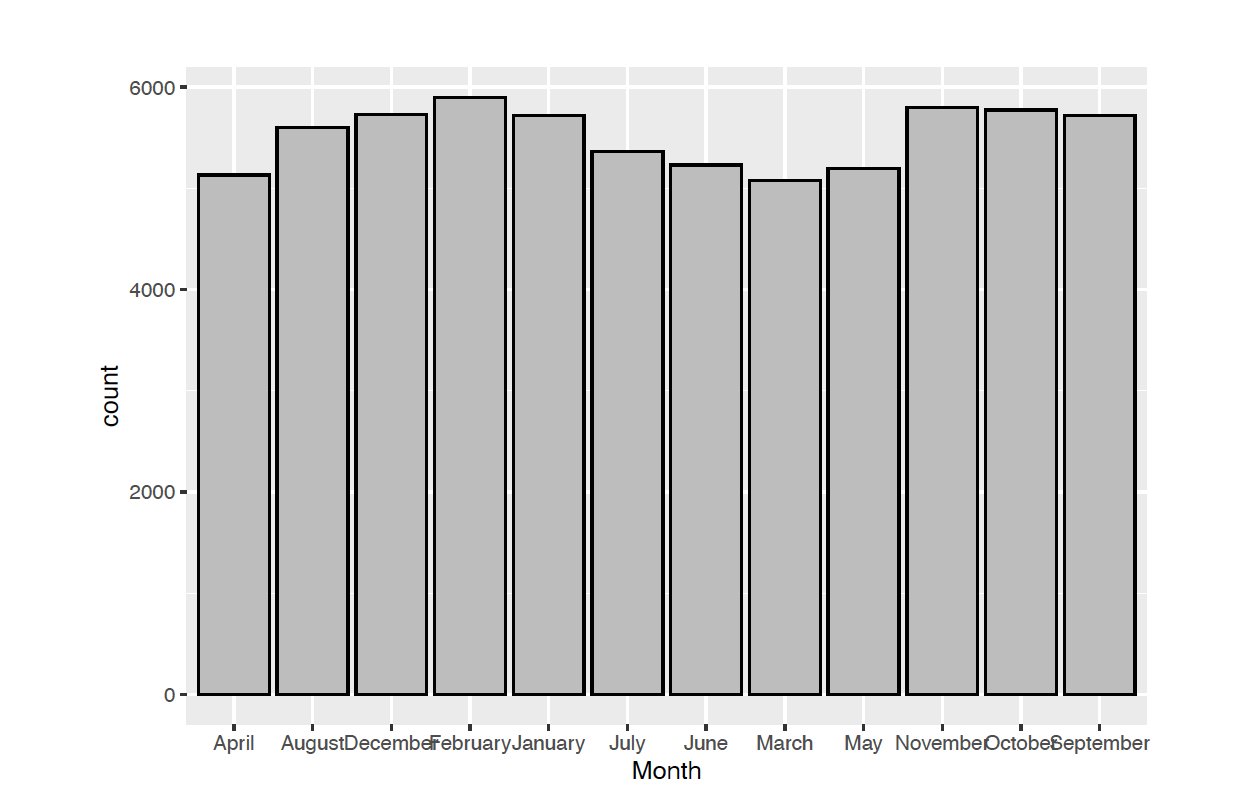
Question: The plot shows a sample of video games, available through Steam, with under 1000 players on at a time. The x-axis is the month and
The plot shows a sample of video games, available through Steam, with under 1000 players on at a time. The x-axis is the month and the y-axis is the number of game players in each month. Describe the graph: State the type of graph, Identify what is on the x- and y-axis (if appropriate), Describe the distribution. Using the Vocabulary List
Step by Step Solution
There are 3 Steps involved in it
1 Expert Approved Answer
Step: 1 Unlock

Question Has Been Solved by an Expert!
Get step-by-step solutions from verified subject matter experts
Step: 2 Unlock
Step: 3 Unlock