

Question: The plot to the right shows the probability function of a random variable Z. Estimate the needed probabilities from the information shown in the plot.
The plot to the right shows the probability function of a random variable Z. Estimate the needed probabilities from the information shown in the plot. What is the probability that Z is greater than or equal to 3 or Z = -3?
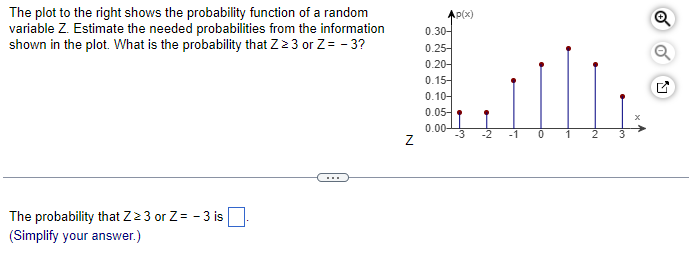
variable 3. Estimate the needed probabilities from the information o_3 shown in the plot. What is the probability that Z 2 3 or E: 3? .12 The plot to the right shows the probability function of a random 5|le (1 Q The probabilityr that 223 or Z = 3 is D. [Simplify your answer.)
Step by Step Solution
There are 3 Steps involved in it
1 Expert Approved Answer
Step: 1 Unlock

Question Has Been Solved by an Expert!
Get step-by-step solutions from verified subject matter experts
Step: 2 Unlock
Step: 3 Unlock