

Question: The plots below show sampling distributions of p-values for different values of power. Match the distribution to the power. Please note that for this problem,
The plots below show sampling distributions of p-values for different values of power. Match the distribution to the power. Please note that for this problem, you must pick values of power for all five plots before submitting your answer, and you will only be marked correct if all five are right. You have five attempts to do this.
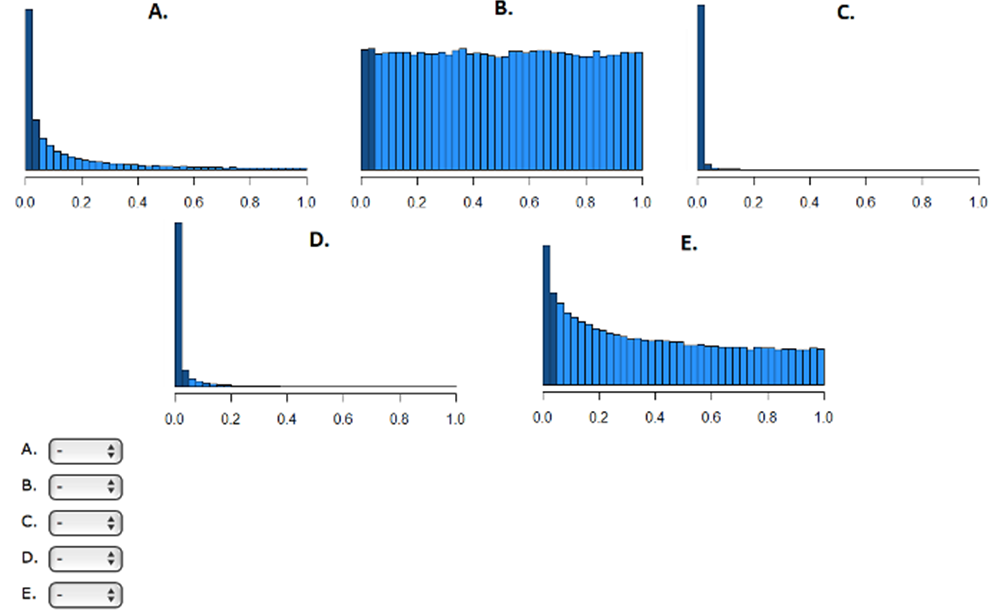
All five of these plots were created using the same sample size. Match each distribution now to the value of Cohen?s d that used to generate it.
0.0 02 < 0.4 0.6 0.8 0.0 0.2 1.0 0.4 D. 0.0 0.6 02 0.8 04 0.6 1.0 0.0 08 1.0 0.2 0.4 0.0 E. 02 0.4 0.6 0.8 1.0 06 0.8 1.0 A. B. C. D. E.
Step by Step Solution
3.39 Rating (158 Votes )
There are 3 Steps involved in it
To match the distributions to their respective powers based on the pvalues lets analyze them 1 Plot ... View full answer

Get step-by-step solutions from verified subject matter experts