

Question: The population a town is increasing as a function of t the number of years, shown by the equation below. P(t) = 100000 ^ (0.08t)
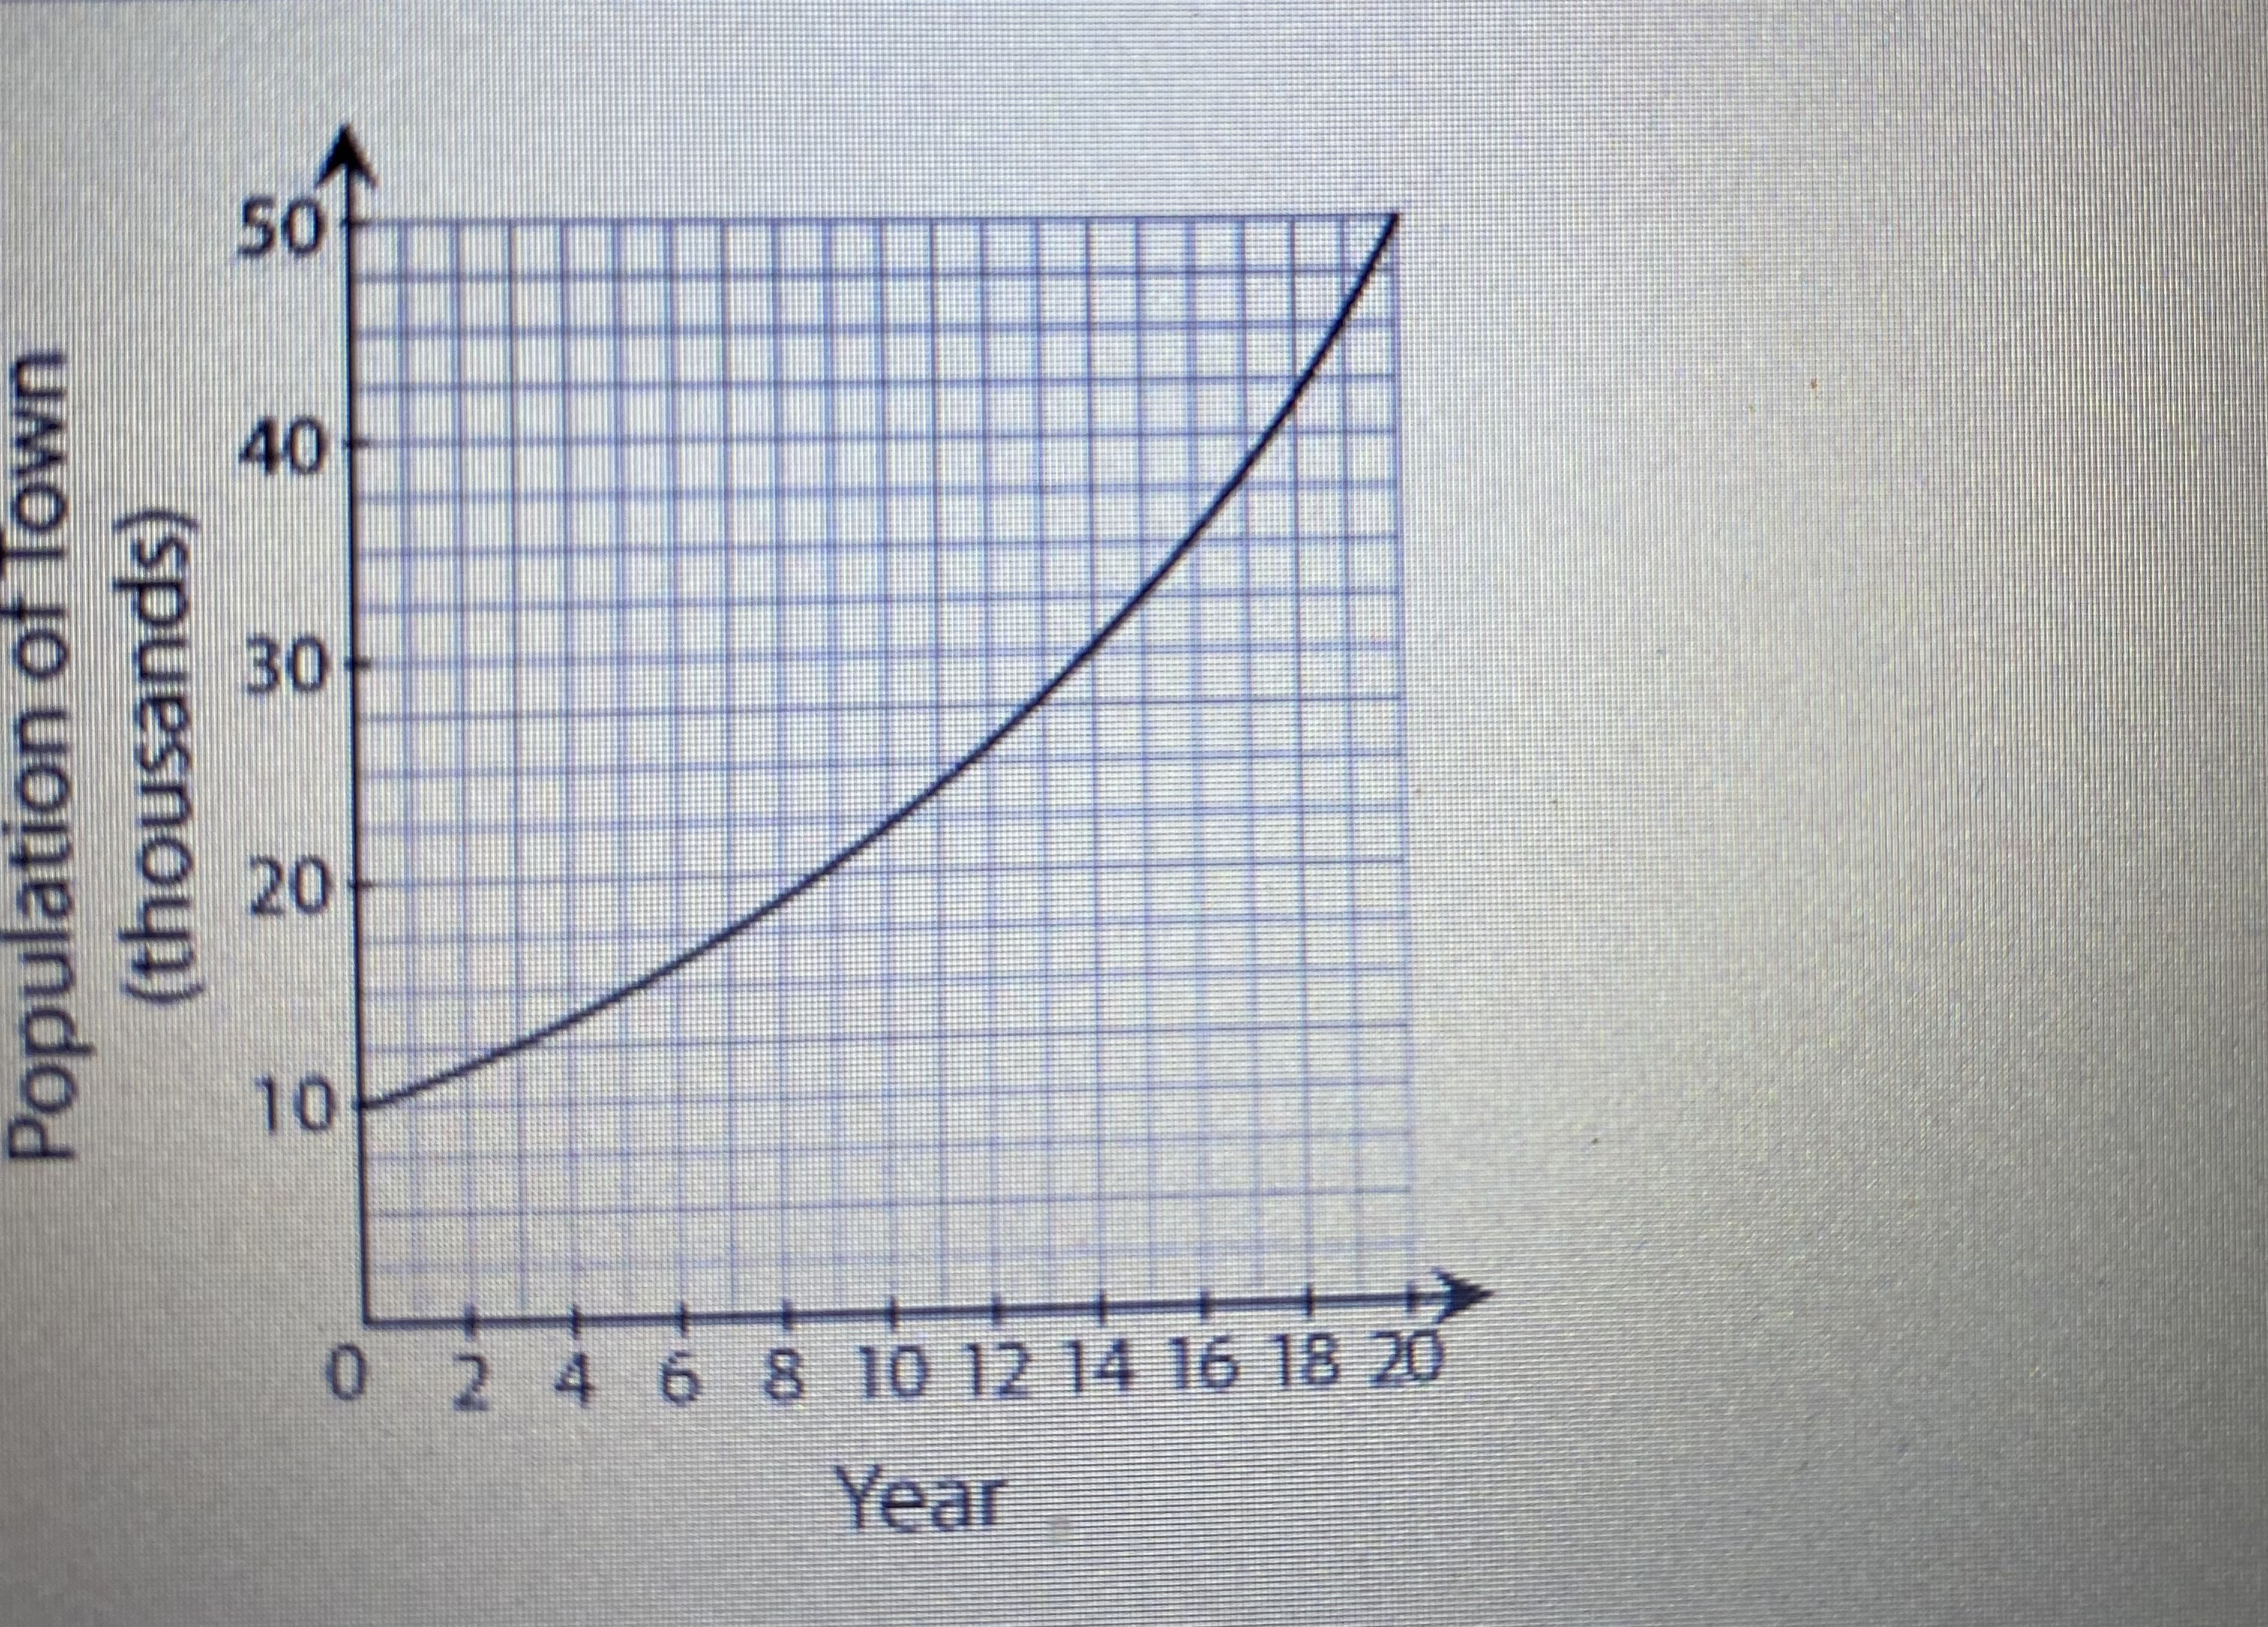

The population a town is increasing as a function of t the number of years, shown by the equation below. P(t) = 100000 ^ (0.08t) Which graph best represents the growth of the town during a period of 20 years?
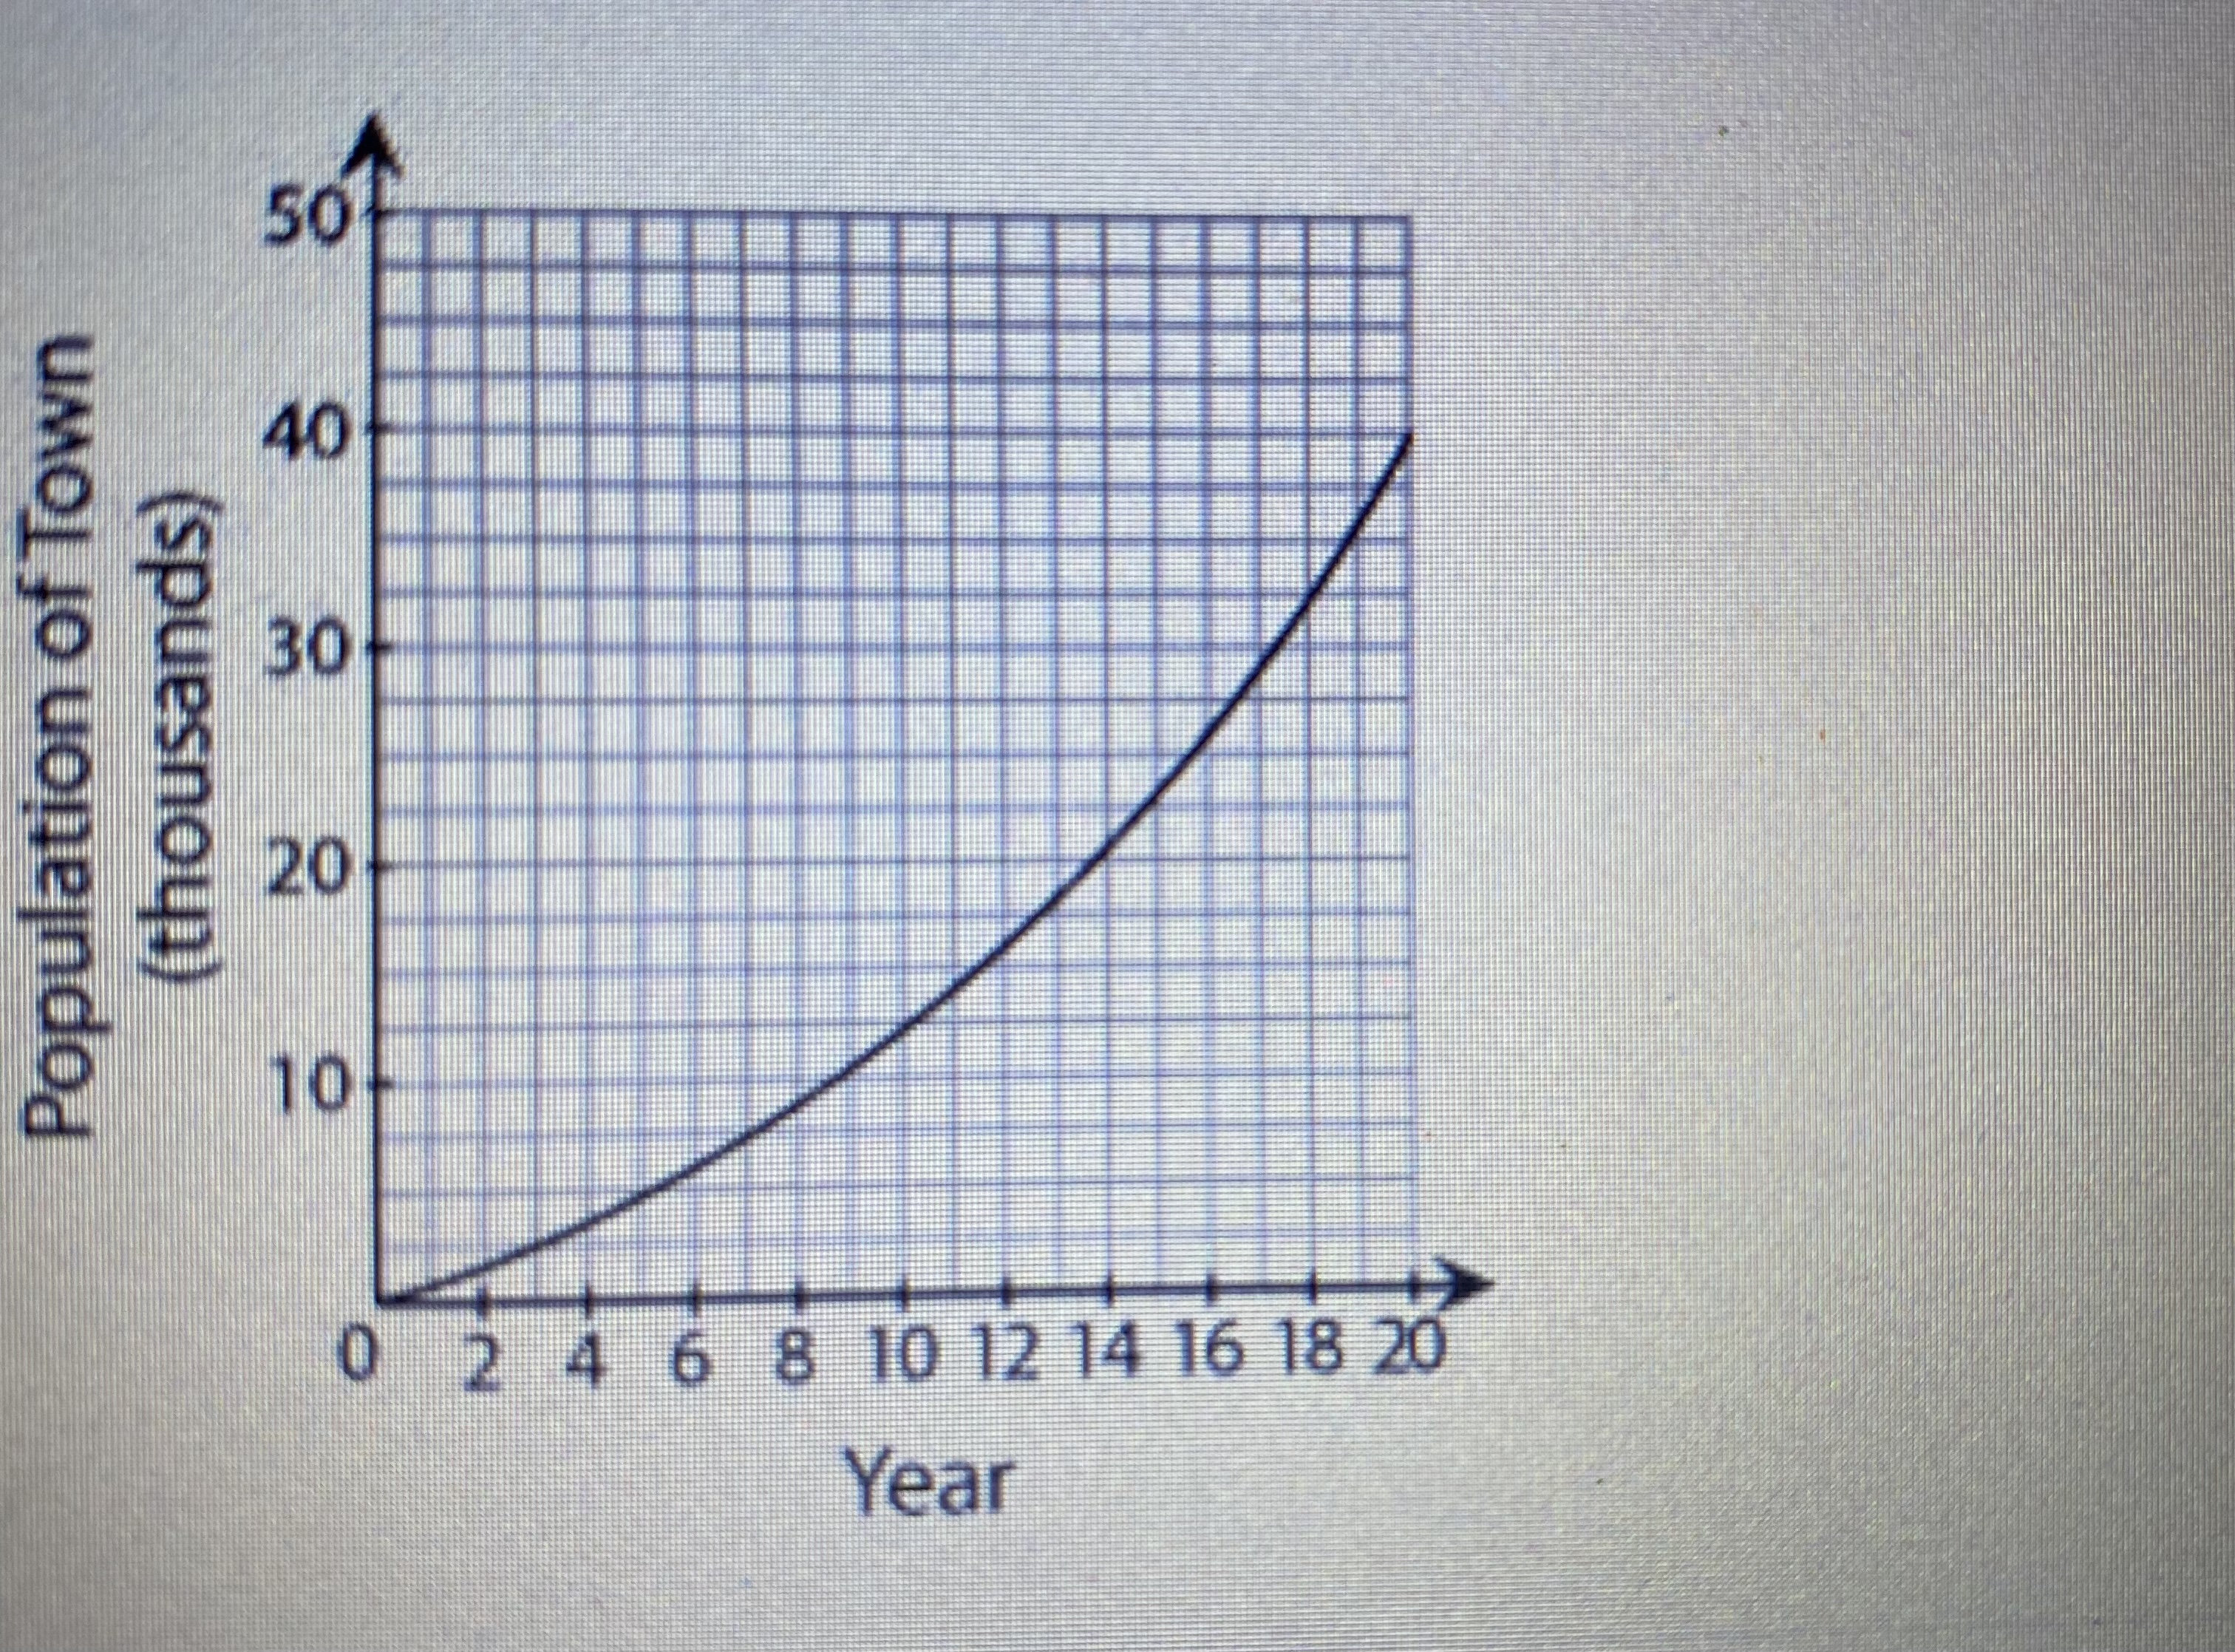
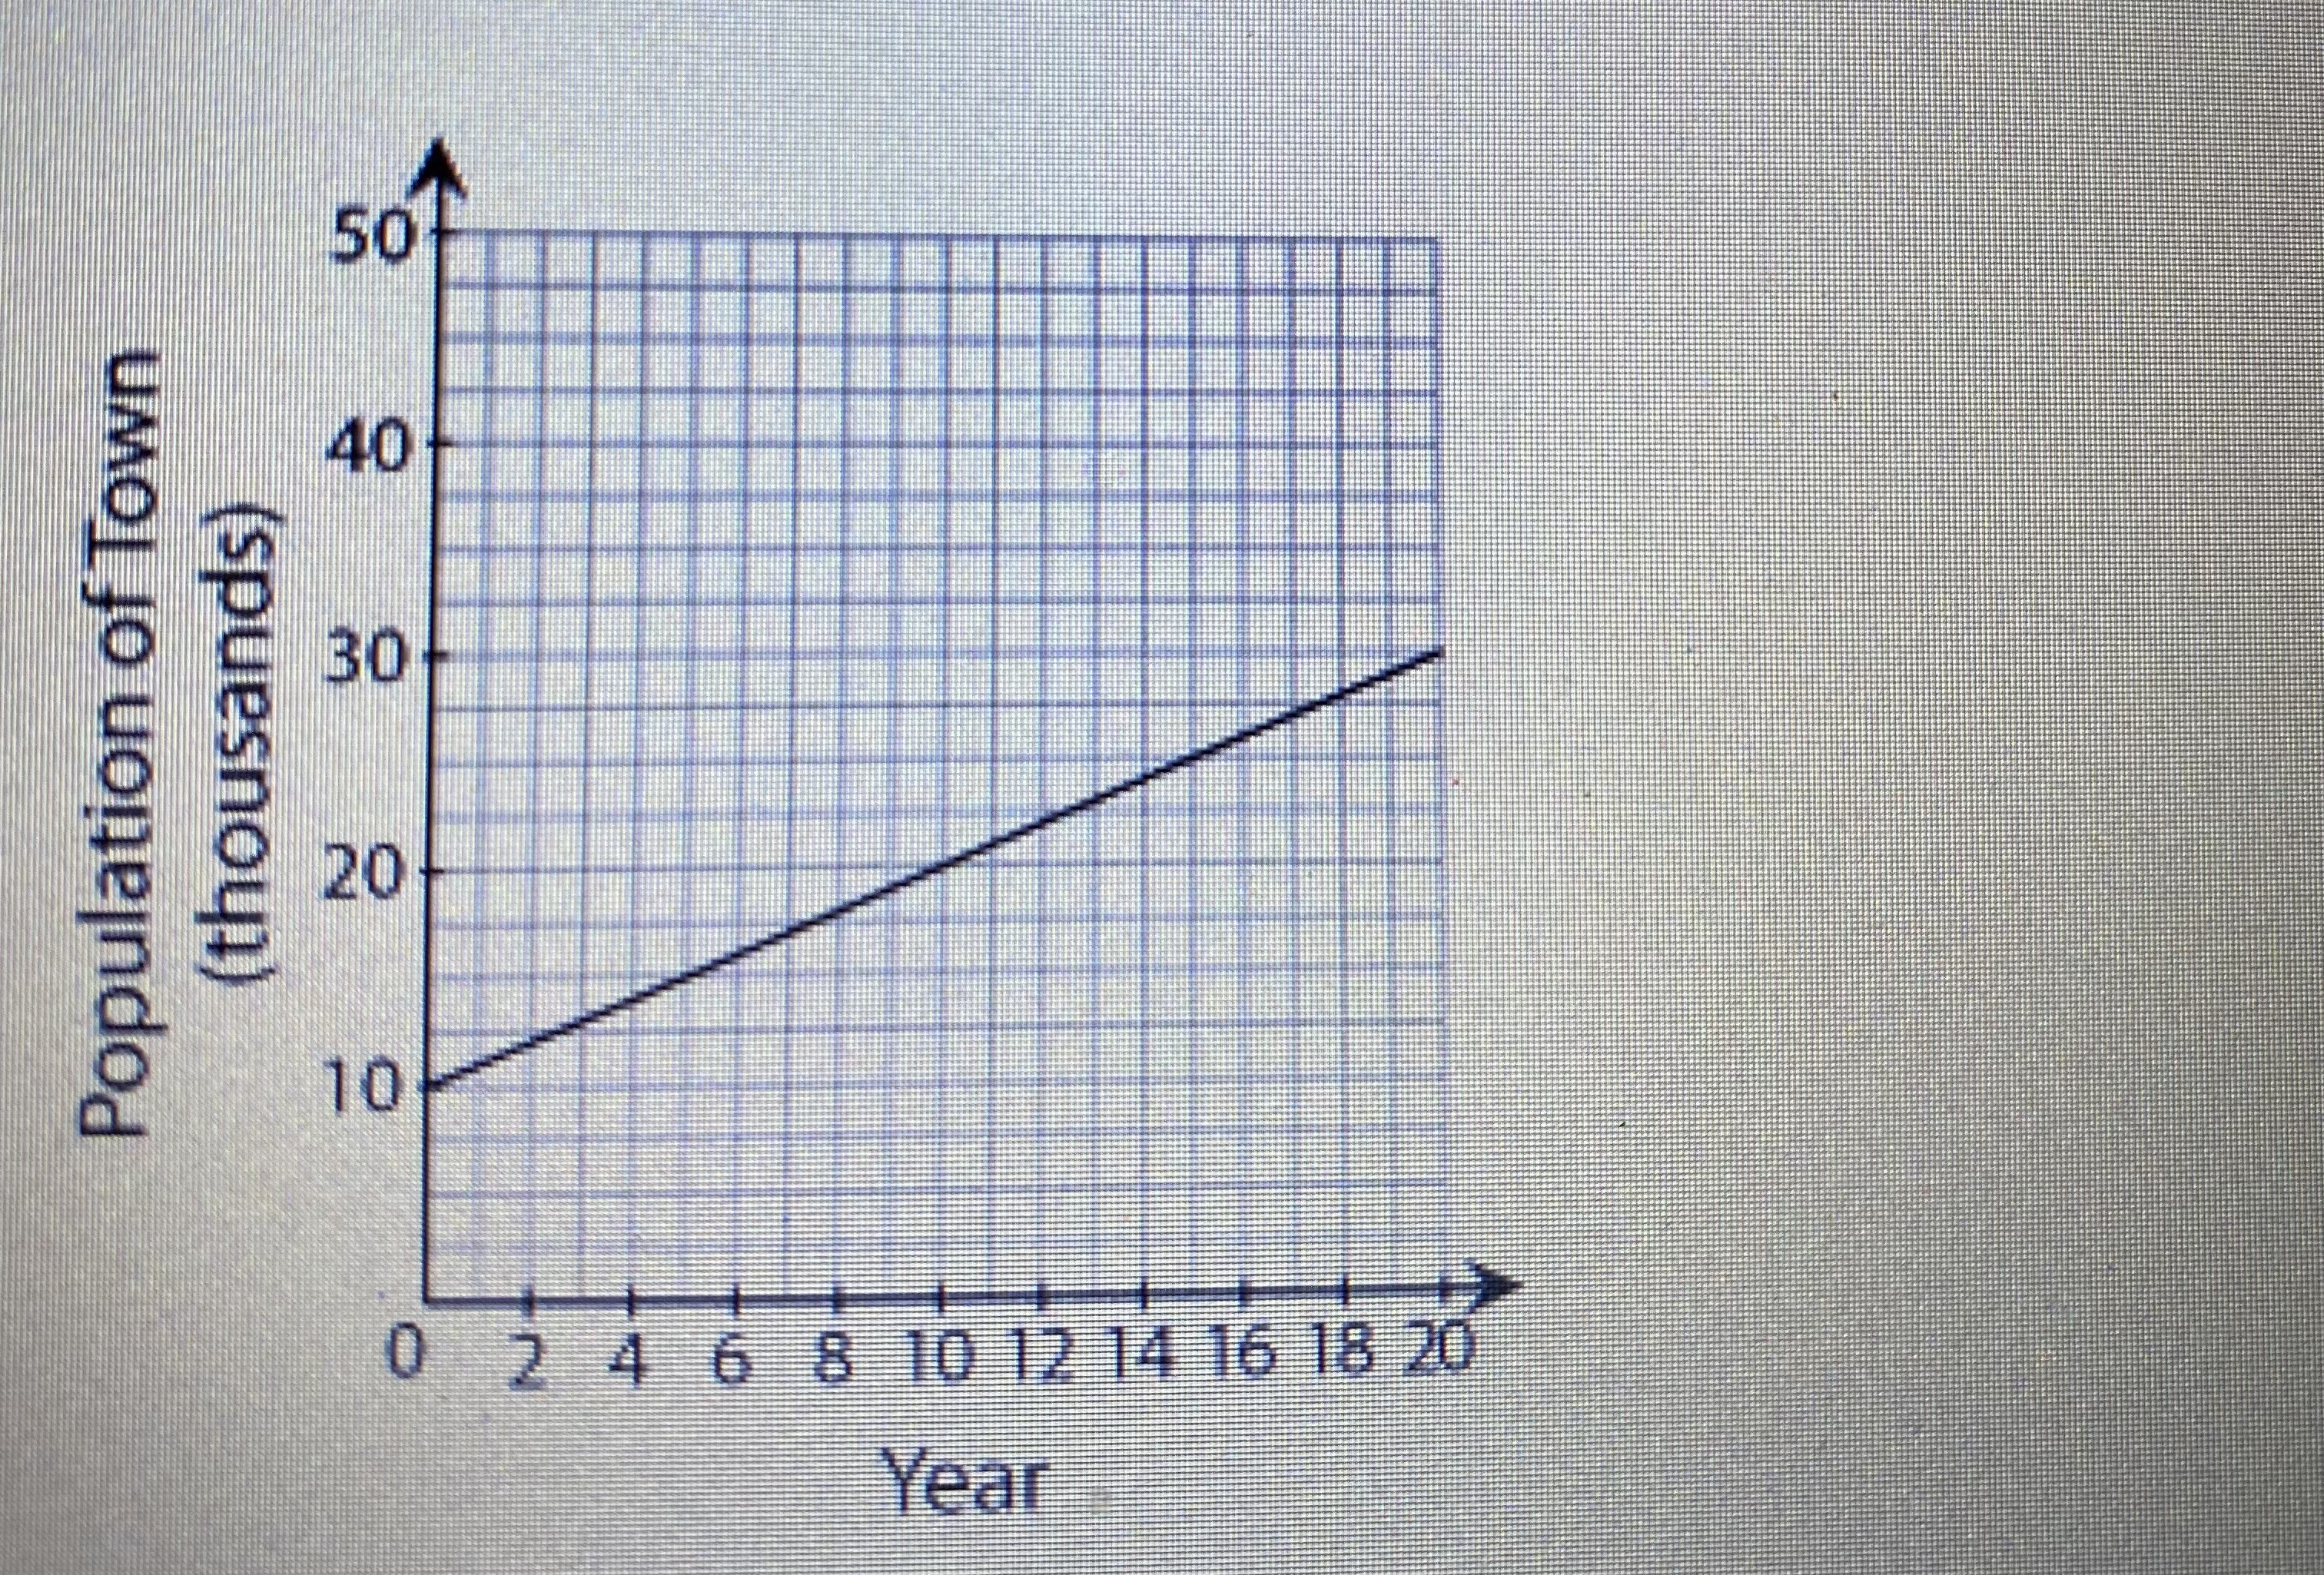

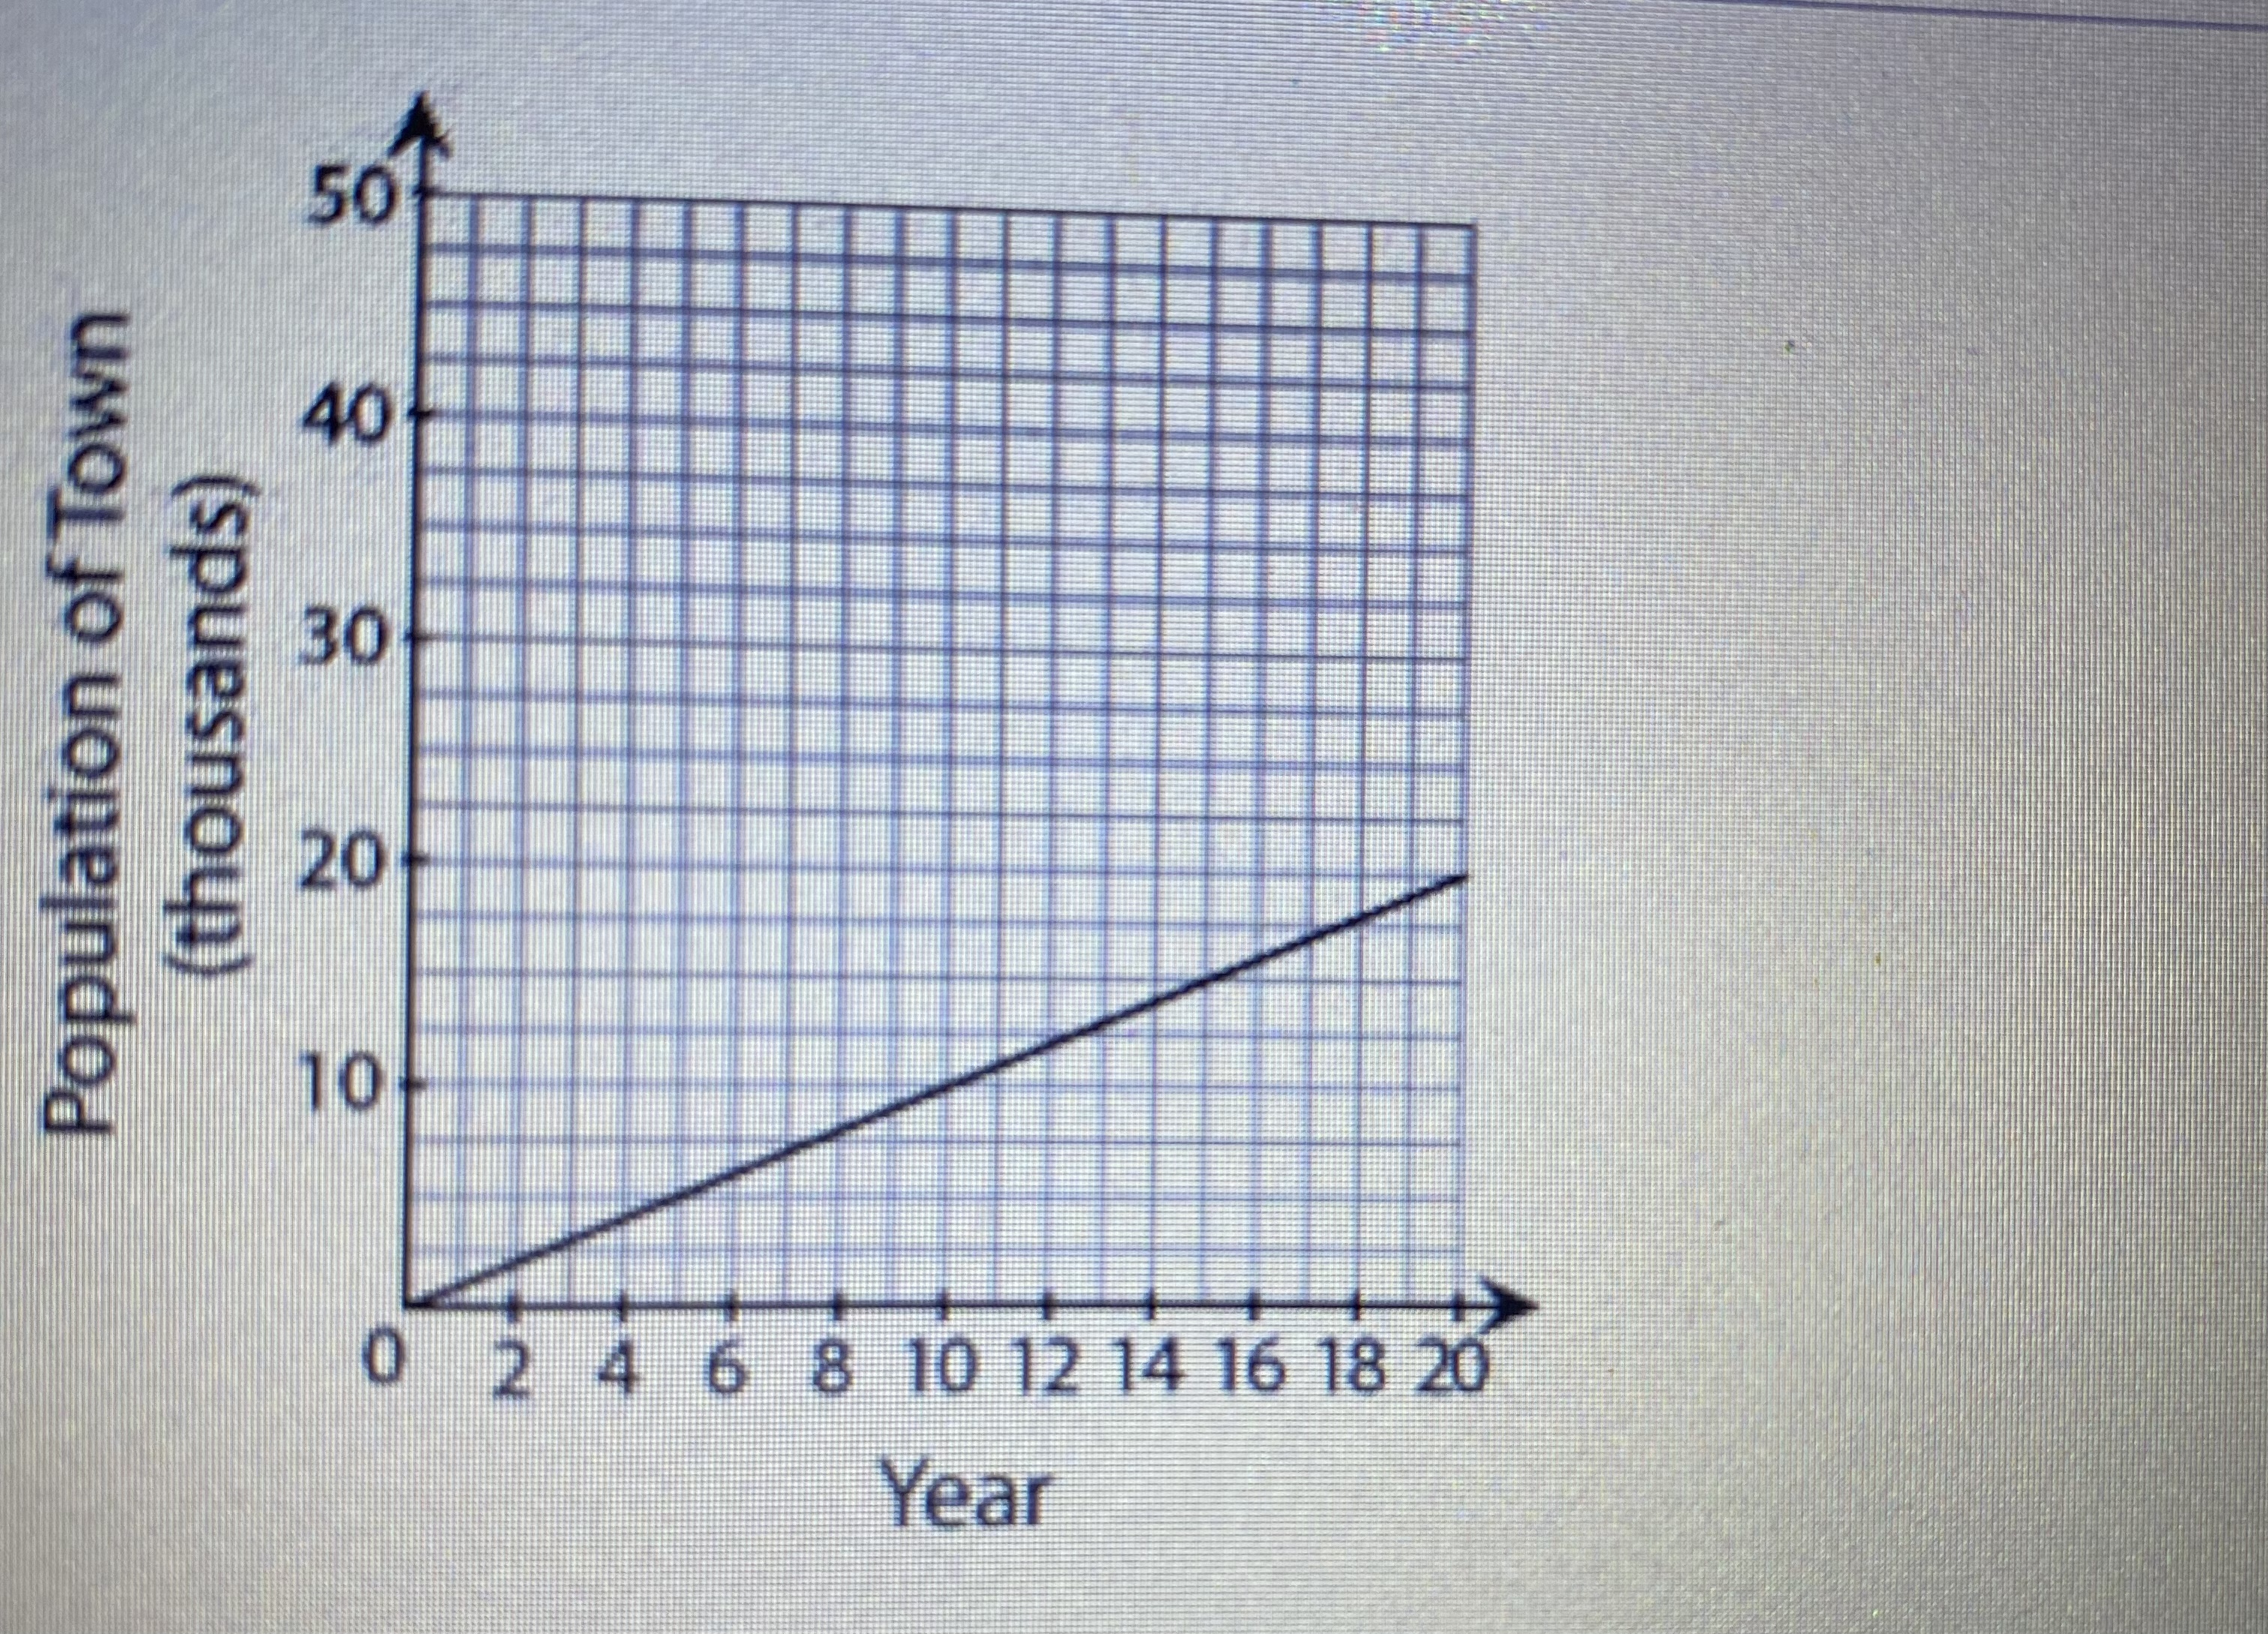
50 40 Population of Town (thousands) 20 10 0 2 4 6 8 10 12 14 16 18 20 Year50 40 (thousands) Population of Town 20 10 0 2 4 6 8 10 12 14 16 18 20 Year50 40 Population of lown (thousands) 20 10 0 2 4 6 8 10 12 14 16 18 20 Year50 40 30 Population of Town (thousands) 20 10 0 2 4 6 8 10 12 14 16 18 20 Year
Step by Step Solution
There are 3 Steps involved in it
1 Expert Approved Answer
Step: 1 Unlock

Question Has Been Solved by an Expert!
Get step-by-step solutions from verified subject matter experts
Step: 2 Unlock
Step: 3 Unlock