

Question: The preceding presentation of the regression equation and variable definition p a good format for displaying the results of a regression analysis model. The results
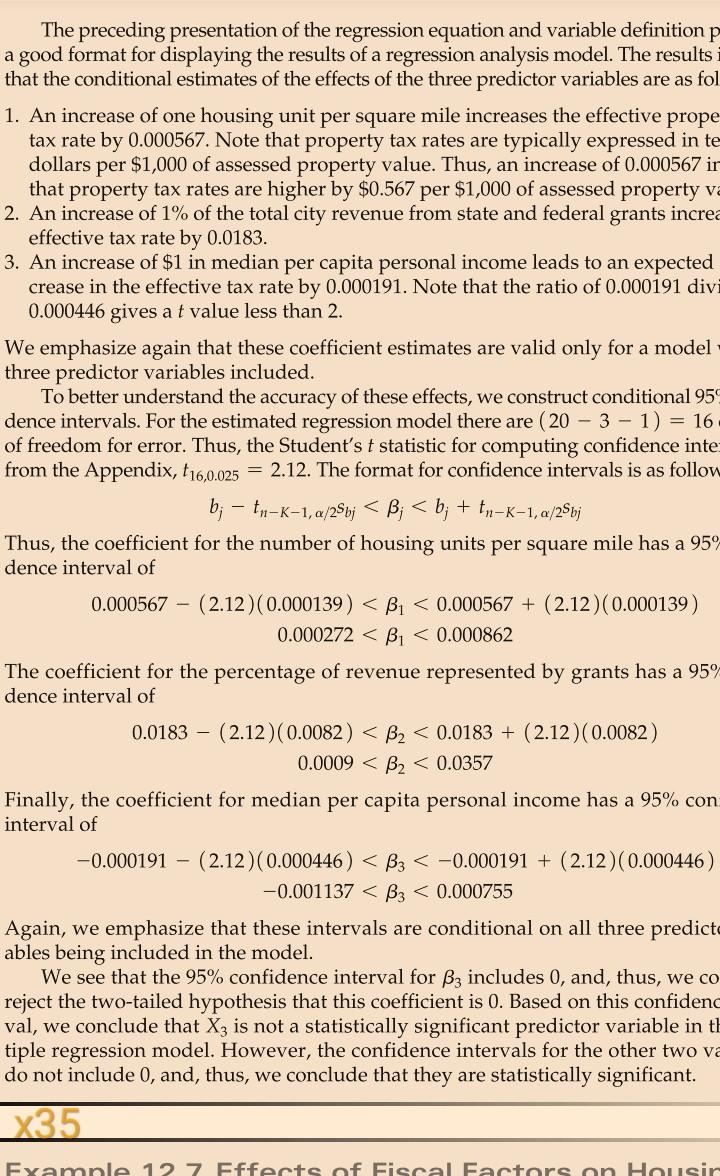
The preceding presentation of the regression equation and variable definition p a good format for displaying the results of a regression analysis model. The results that the conditional estimates of the effects of the three predictor variables are as fol 1. An increase of one housing unit per square mile increases the effective prope tax rate by 0.000567. Note that property tax rates are typically expressed in te dollars per $1,000 of assessed property value. Thus, an increase of 0.000567 ir that property tax rates are higher by $0.567 per $1,000 of assessed property va 2. An increase of 1% of the total city revenue from state and federal grants increa effective tax rate by 0.0183. 3. An increase of $1 in median per capita personal income leads to an expected crease in the effective tax rate by 0.000191. Note that the ratio of 0.000191 divi 0.000446 gives a t value less than 2. We emphasize again that these coefficient estimates are valid only for a model three predictor variables included. To better understand the accuracy of these effects, we construct conditional 95 dence intervals. For the estimated regression model there are 20 - 3 - 1) = 16 of freedom for error. Thus, the Student's t statistic for computing confidence inte from the Appendix, t16,0.025 = 2.12. The format for confidence intervals is as follow b; tn-K-1, a/2Sb;
Step by Step Solution
There are 3 Steps involved in it
1 Expert Approved Answer
Step: 1 Unlock

Question Has Been Solved by an Expert!
Get step-by-step solutions from verified subject matter experts
Step: 2 Unlock
Step: 3 Unlock