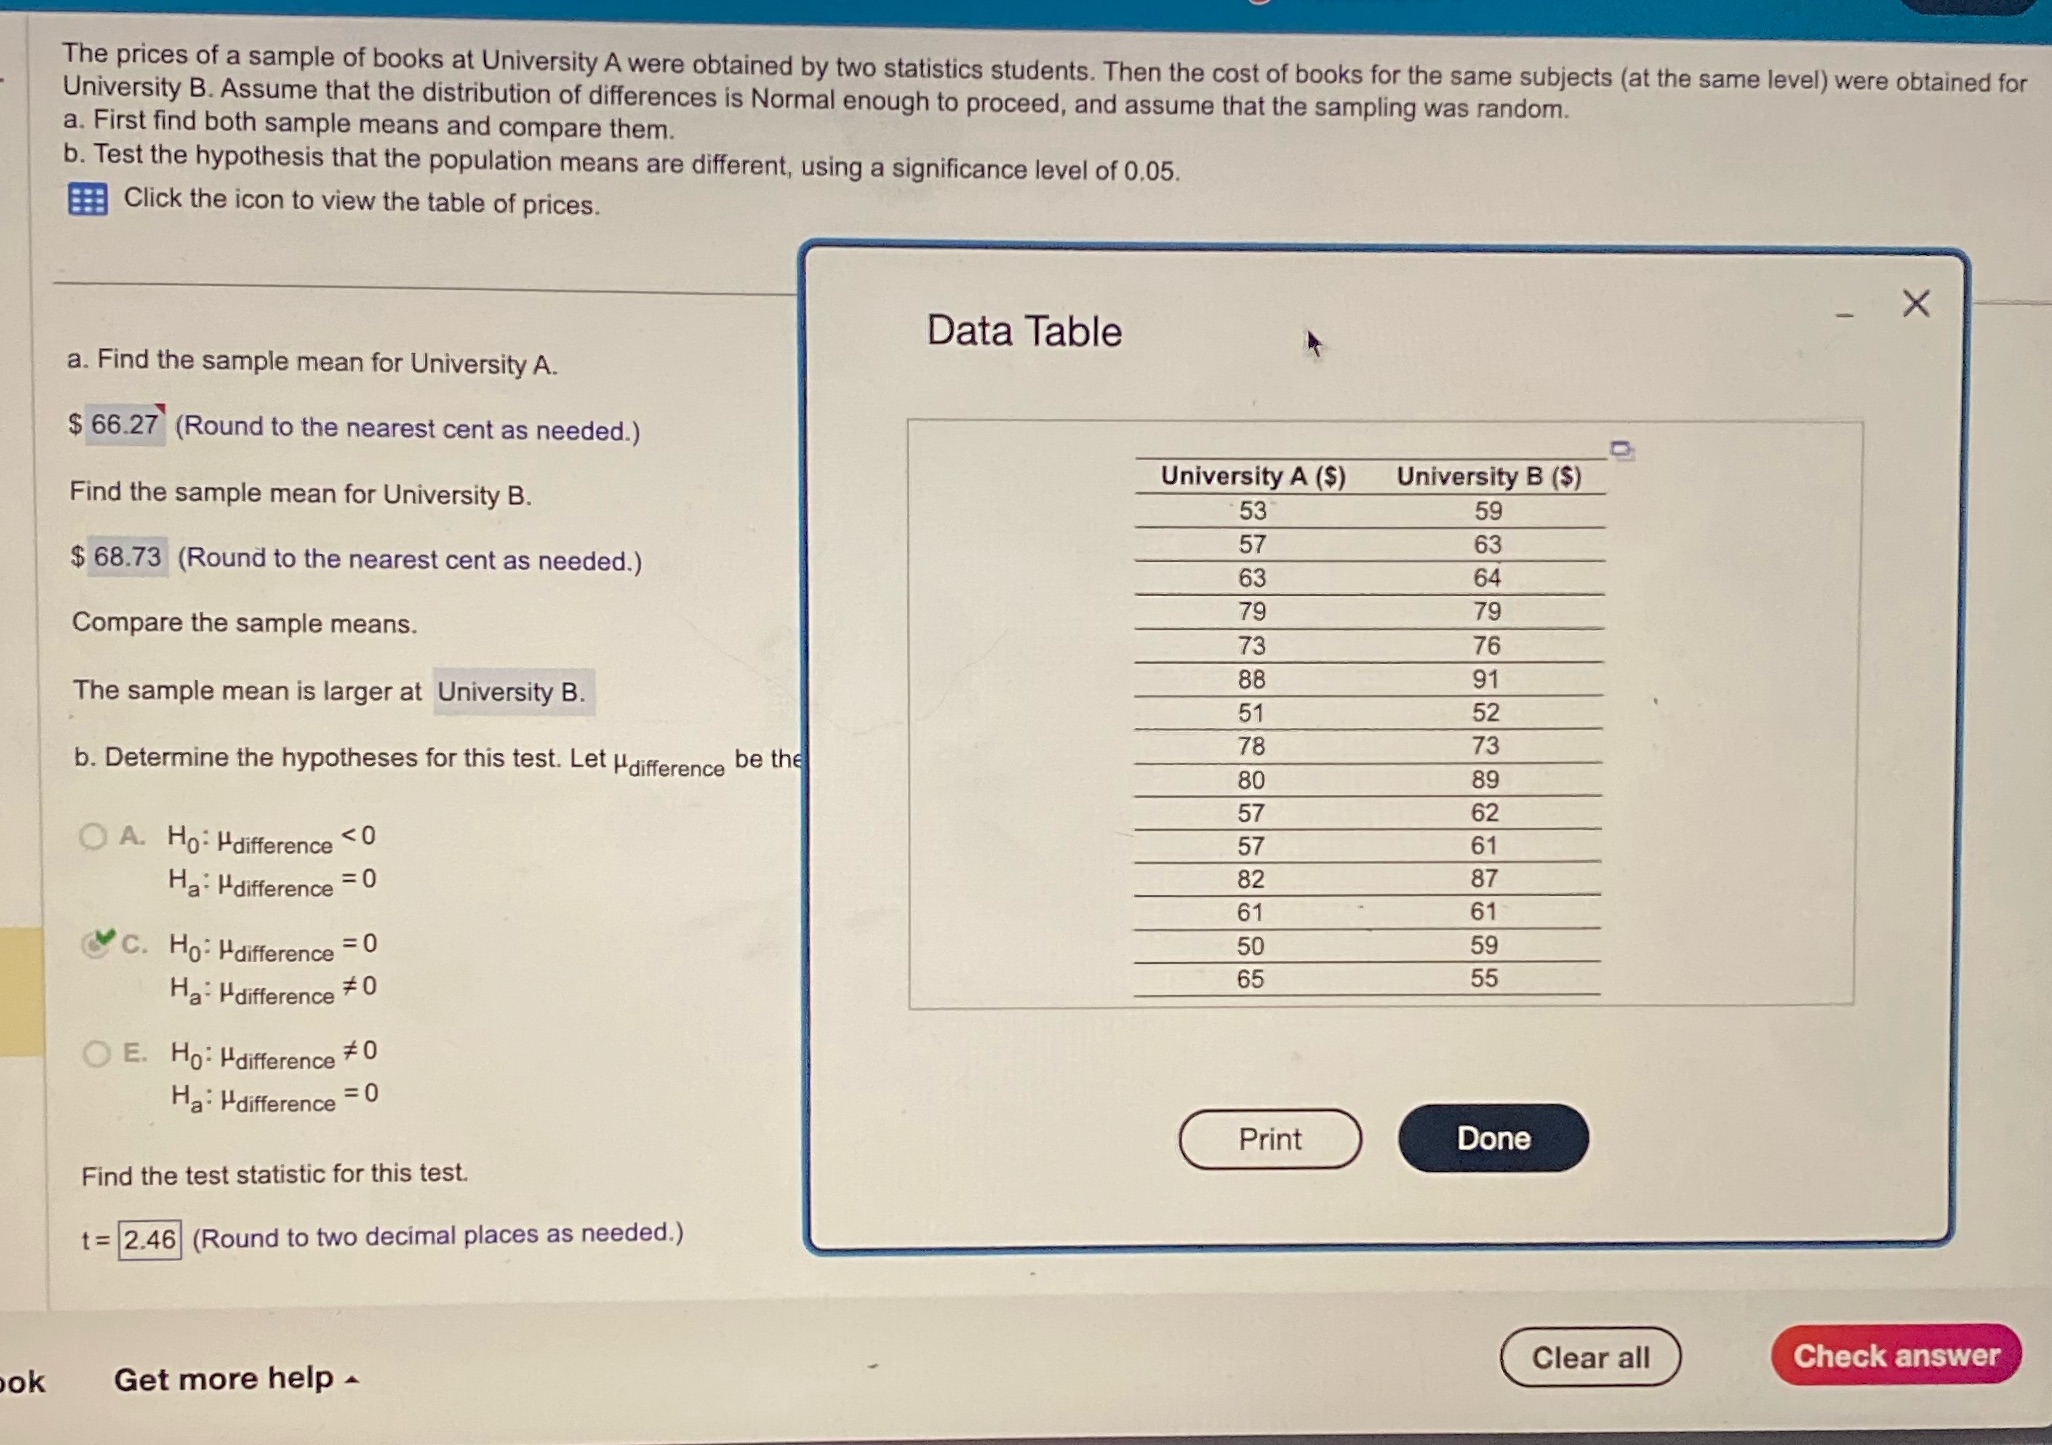
The prices of a sample of books at University A were obtained by two statistics students....
Fantastic news! We've Found the answer you've been seeking!
Question:
Transcribed Image Text:
The prices of a sample of books at University A were obtained by two statistics students. Then the cost of books for the same subjects (at the same level) were obtained for University B. Assume that the distribution of differences is Normal enough to proceed, and assume that the sampling was random. a. First find both sample means and compare them. b. Test the hypothesis that the population means are different, using a significance level of 0.05. Click the icon to view the table of prices. Data Table a. Find the sample mean for University A. $ 66.27 (Round to the nearest cent as needed.) Find the sample mean for University B. $68.73 (Round to the nearest cent as needed.) Compare the sample means. University A ($) University B ($) 53 59 57 63 63 64 79 79 73 76 The sample mean is larger at University B. 88 91 51 52 b. Determine the hypotheses for this test. Let Hdifference be the 78 73 OA. Ho Hdifference <0 57 Ha- Hdifference = 0 2152448 89 62 61 87 61 59 55 C. Ho Hdifference = 0 Ha- Hdifference #0 E. Ho Hdifference #0 Ha "difference = 0 Find the test statistic for this test. t=2.46 (Round to two decimal places as needed.) bok Get more help - 4 Print Done Clear all Check answer The prices of a sample of books at University A were obtained by two statistics students. Then the cost of books for the same subjects (at the same level) were obtained for University B. Assume that the distribution of differences is Normal enough to proceed, and assume that the sampling was random. a. First find both sample means and compare them. b. Test the hypothesis that the population means are different, using a significance level of 0.05. Click the icon to view the table of prices. Data Table a. Find the sample mean for University A. $ 66.27 (Round to the nearest cent as needed.) Find the sample mean for University B. $68.73 (Round to the nearest cent as needed.) Compare the sample means. University A ($) University B ($) 53 59 57 63 63 64 79 79 73 76 The sample mean is larger at University B. 88 91 51 52 b. Determine the hypotheses for this test. Let Hdifference be the 78 73 OA. Ho Hdifference <0 57 Ha- Hdifference = 0 2152448 89 62 61 87 61 59 55 C. Ho Hdifference = 0 Ha- Hdifference #0 E. Ho Hdifference #0 Ha "difference = 0 Find the test statistic for this test. t=2.46 (Round to two decimal places as needed.) bok Get more help - 4 Print Done Clear all Check answer
Expert Answer:
Posted Date:
Students also viewed these mathematics questions
-
Determine the real roots of (x) = - 1 + 5.5x 4x2 + 0.5x3: (a) Graphically and (b) Using the Newton-Raphson method to within s = 0.01%.
-
The Bishop Division of Kingley Corporation has a current ROI of 12 percent. The company target ROI is 8 percent. The Bishop Division has an opportunity to invest $6,000,000 at 10 percent but is...
-
How has technology impacted how managers use the quantitative approach in todays workplace?
-
The management of Essen Manufacturing Company is currently evaluating a proposal to purchase a new and innovative drill press as a replacement for a less efficient piece of similar equipment which...
-
A company constructs a building for its own use. Construction began on January 1 and ended on December 30. The expenditures for construction were as follows: January 1, $500,000; March 31, $600,000;...
-
The goal in this assignment is to develop a machine learning model that can classify between images of T-shirts and dress-shirts. You are given the following files: (download files from link : https:/
-
Suppose you have a loan with a balance of $10,000, an interest rate of 6% (compounded monthly) and required monthly payments of $100.This loan will take 11 years and 7 months to pay off in you only...
-
50. Four point charges are placed on the corners of a square of side d, as shown in Figure P15.50. (a) Find the net force (mag- nitude and direction) on each charge. (b) If a fifth charge of size +Q...
-
Please answer all parts of the question. Diagrams are provided. You must select and refer to that graph number (as appropriate) in your answer. Please be sure to discuss fully any graphs or diagrams...
-
Evaluate how well HRM initiatives contribute to organizational goals and pinpoint any elements that can obstruct their accomplishment.
-
1. The figure below shows Jenny's feasible frontier and indifference curves. Assume that her current allocation of time for study and leisure is represented by point C. Explain why Jenny's utility is...
-
Key comparative figures for Apple and Google follow. Apple $ millions Current Year Net sales Cost of sales $ 394,328 223,546 Prior Year $ 365,817 212,981 Google Current Year Prior Year $ 282,836 $...
-
A reaction 2A? P has a second-order rate law with &-4.30 x10 M's'. Calculate the time required for the concentration of A to change from 0.210 M to 0.01 M.
-
What is EBIT/eps analysis? What information does it provide managers?
Study smarter with the SolutionInn App