

Question: The probability density function (pdf) for a 2-dimensional real-valued random vector X is as follows: p(x)=P(L=0)p(xL=0)+P(L=1)p(xL=1). Here L is the true class label that indicates
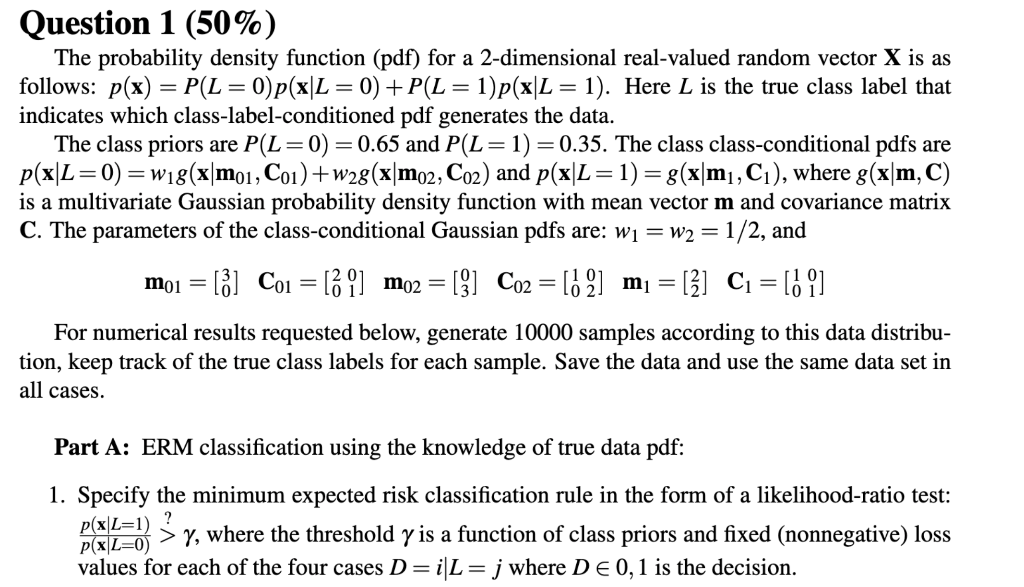
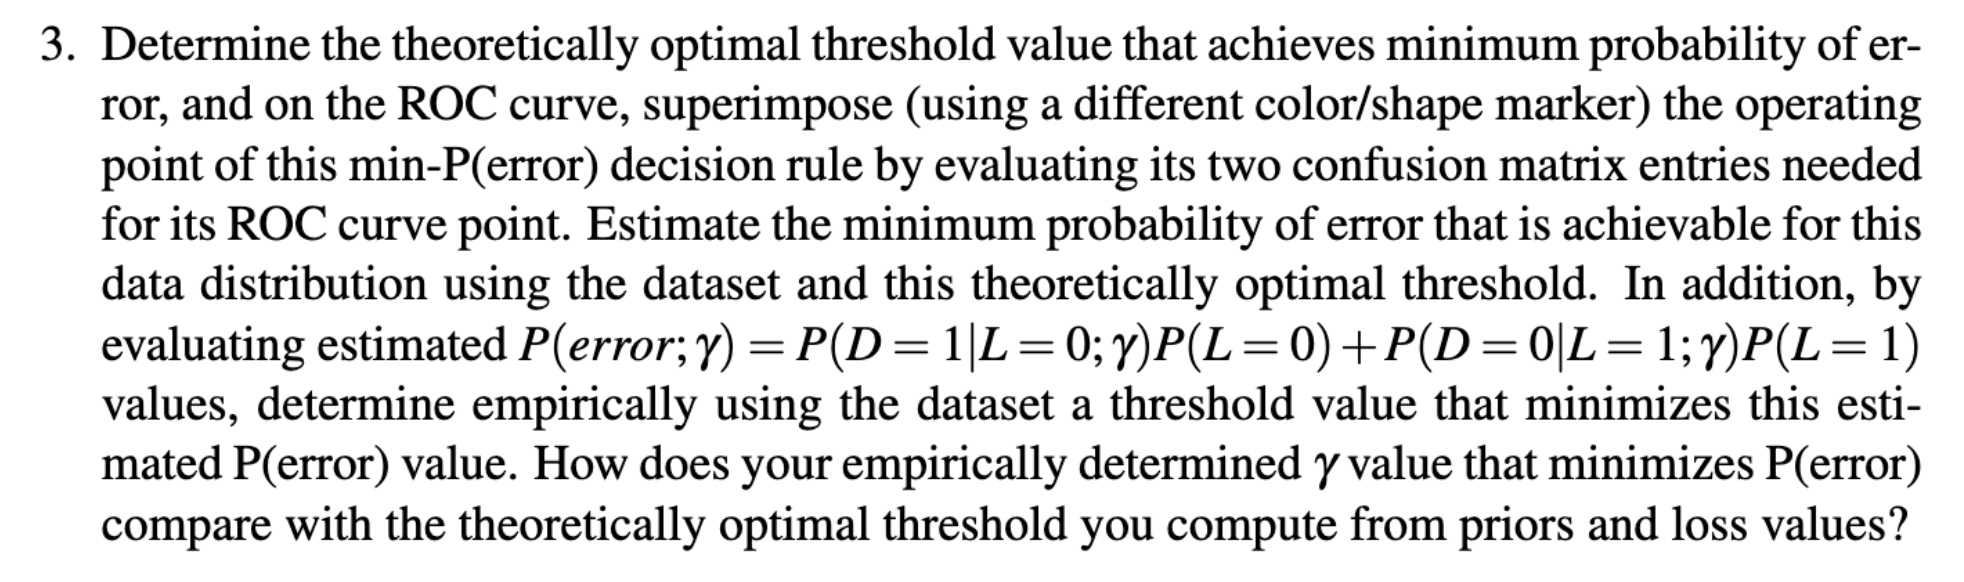
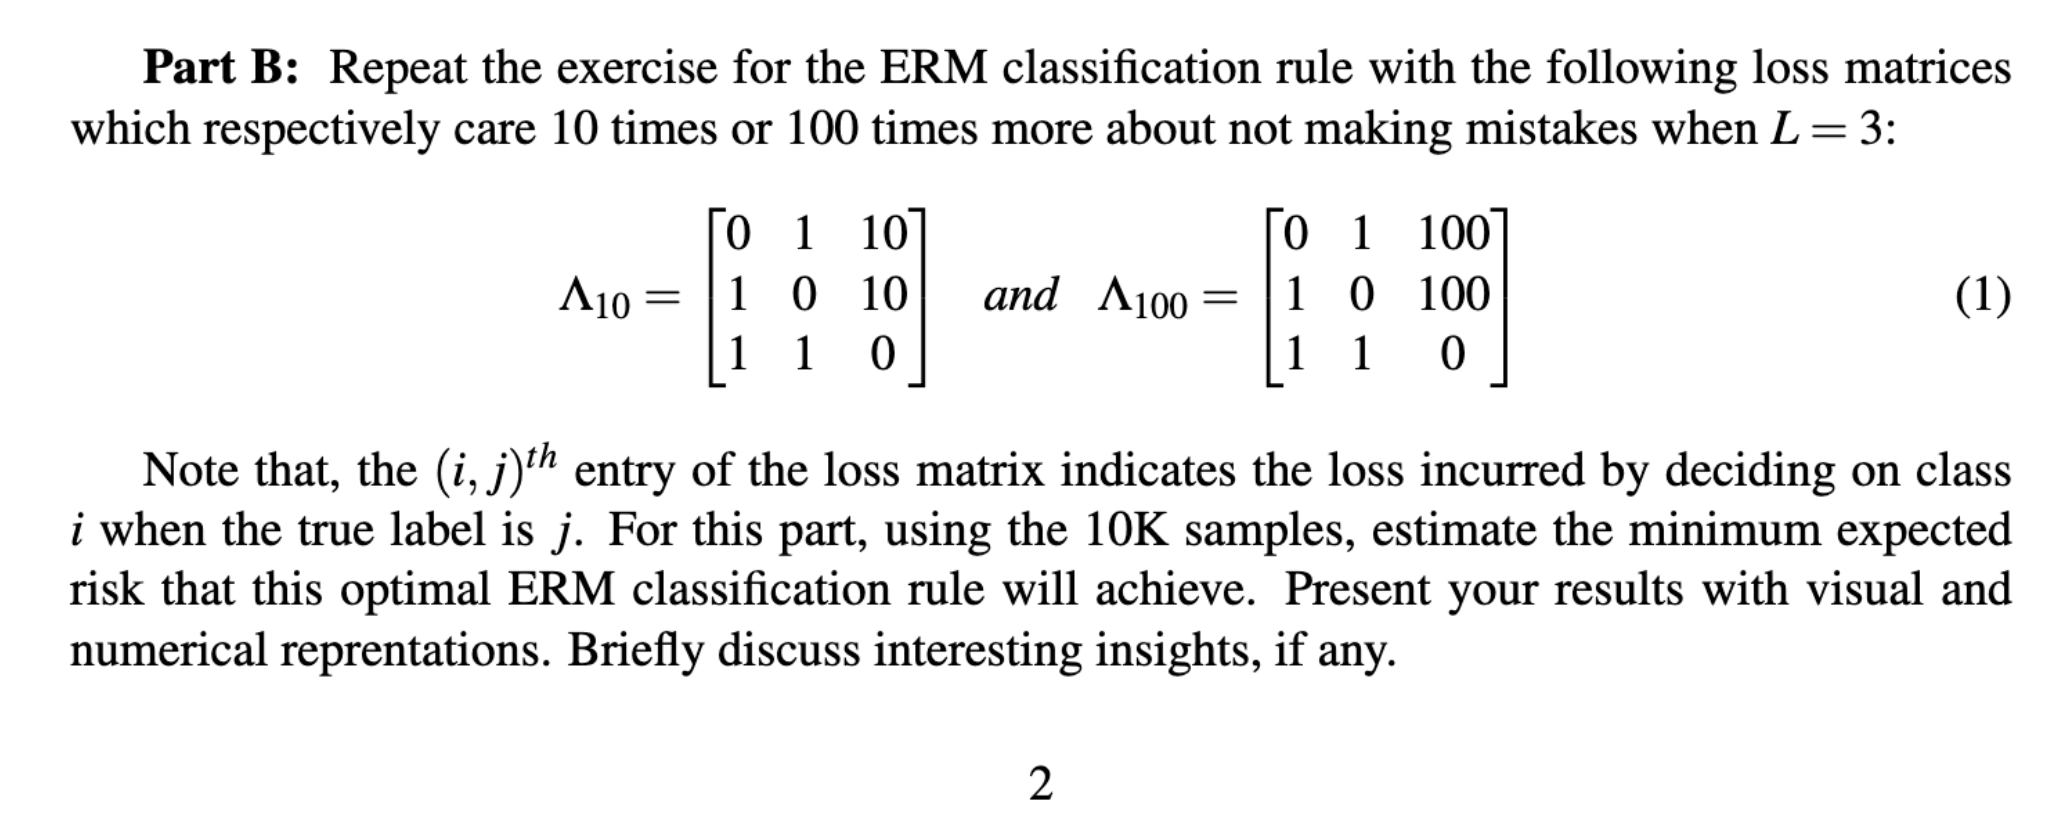
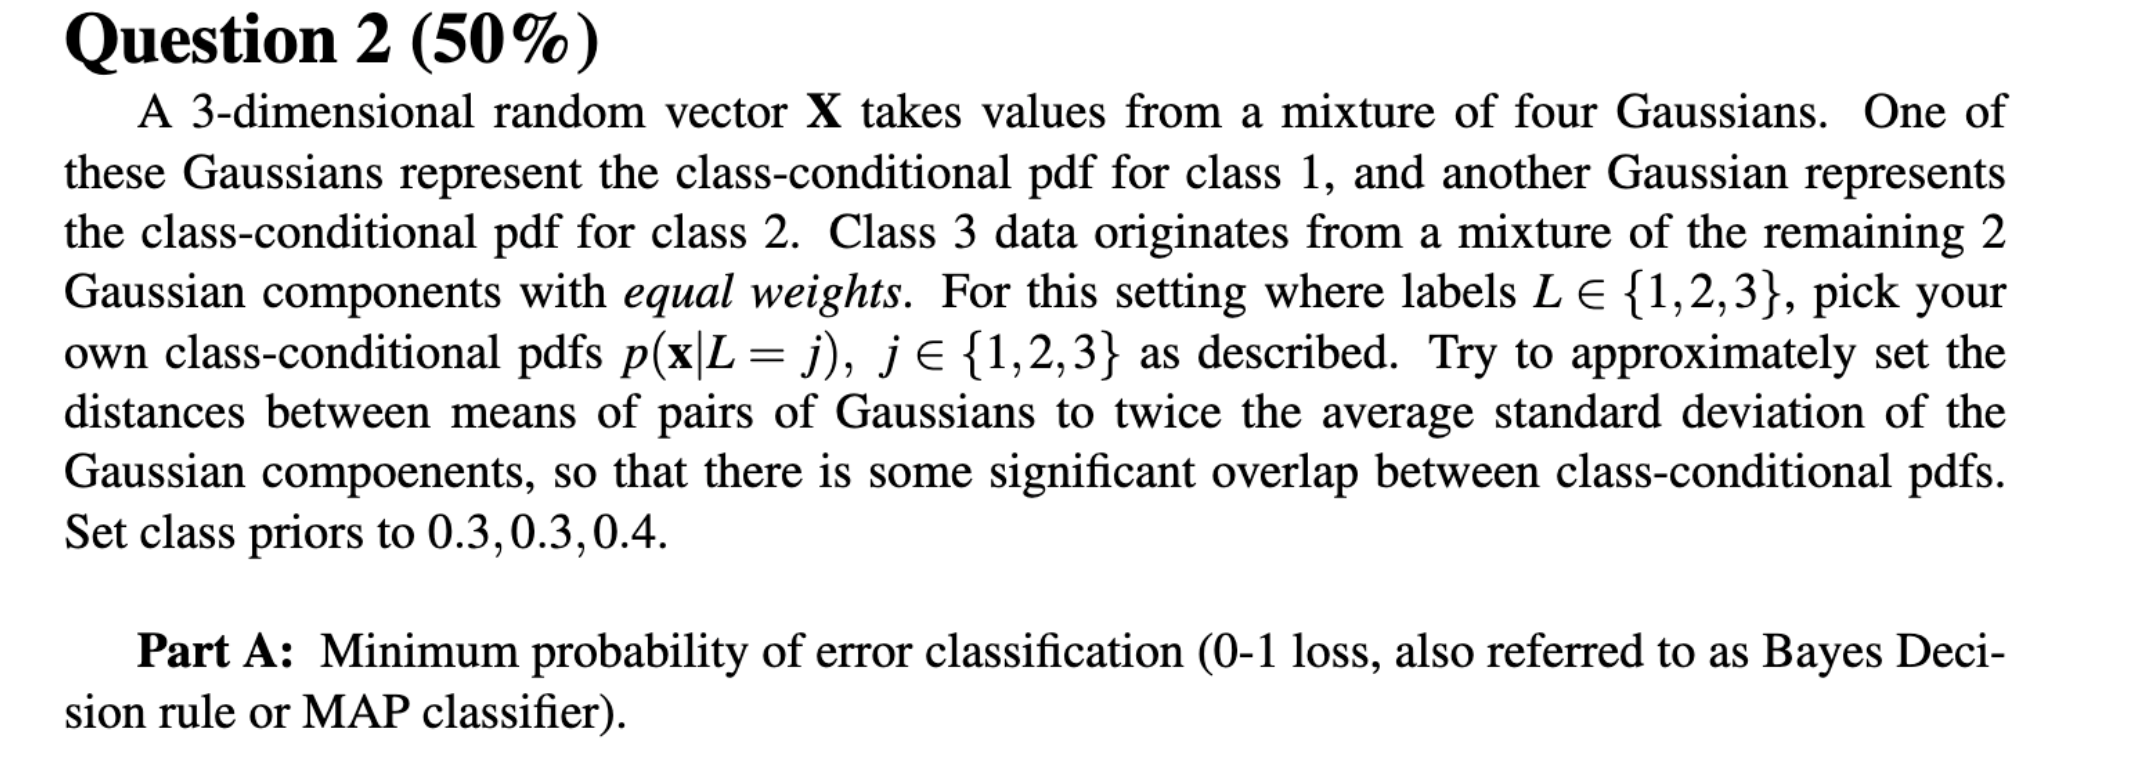
The probability density function (pdf) for a 2-dimensional real-valued random vector X is as follows: p(x)=P(L=0)p(xL=0)+P(L=1)p(xL=1). Here L is the true class label that indicates which class-label-conditioned pdf generates the data. The class priors are P(L=0)=0.65 and P(L=1)=0.35. The class class-conditional pdfs are p(xL=0)=w1g(xm01,C01)+w2g(xm02,C02) and p(xL=1)=g(xm1,C1), where g(xm,C) is a multivariate Gaussian probability density function with mean vector m and covariance matrix C. The parameters of the class-conditional Gaussian pdfs are: w1=w2=1/2, and m01=[30]C01=[2001]m02=[03]C02=[1002]m1=[22]C1=[1001] For numerical results requested below, generate 10000 samples according to this data distribution, keep track of the true class labels for each sample. Save the data and use the same data set in all cases. Part A: ERM classification using the knowledge of true data pdf: 1. Specify the minimum expected risk classification rule in the form of a likelihood-ratio test: p(xL=0)p(xL=1)>?, where the threshold is a function of class priors and fixed (nonnegative) loss values for each of the four cases D=iL=j where D0,1 is the decision. 3. Determine the theoretically optimal threshold value that achieves minimum probability of error, and on the ROC curve, superimpose (using a different color/shape marker) the operating point of this min-P(error) decision rule by evaluating its two confusion matrix entries needed for its ROC curve point. Estimate the minimum probability of error that is achievable for this data distribution using the dataset and this theoretically optimal threshold. In addition, by evaluating estimated P( error; )=P(D=1L=0;)P(L=0)+P(D=0L=1;)P(L=1) values, determine empirically using the dataset a threshold value that minimizes this estimated P (error) value. How does your empirically determined value that minimizes P (error) compare with the theoretically optimal threshold you compute from priors and loss values? Part B: Repeat the exercise for the ERM classification rule with the following loss matrices which respectively care 10 times or 100 times more about not making mistakes when L=3 : 10=01110110100and100=0111011001000 Note that, the (i,j)th entry of the loss matrix indicates the loss incurred by deciding on class i when the true label is j. For this part, using the 10K samples, estimate the minimum expected risk that this optimal ERM classification rule will achieve. Present your results with visual and numerical reprentations. Briefly discuss interesting insights, if any. Question 2(50%) A 3-dimensional random vector X takes values from a mixture of four Gaussians. One of these Gaussians represent the class-conditional pdf for class 1 , and another Gaussian represents the class-conditional pdf for class 2 . Class 3 data originates from a mixture of the remaining 2 Gaussian components with equal weights. For this setting where labels L{1,2,3}, pick your own class-conditional pdfs p(xL=j),j{1,2,3} as described. Try to approximately set the distances between means of pairs of Gaussians to twice the average standard deviation of the Gaussian compoenents, so that there is some significant overlap between class-conditional pdfs. Set class priors to 0.3,0.3,0.4. Part A: Minimum probability of error classification (0-1 loss, also referred to as Bayes Decision rule or MAP classifier). 2. Specify the decision rule that achieves minimum probability of error (i.e., use 01 loss), implement this classifier with the true data distribution knowledge, classify the 10K samples and count the samples corresponding to each decision-label pair to empirically estimate the confusion matrix whose entries are P(D=iL=j) for i,j{1,2,3}
Step by Step Solution
There are 3 Steps involved in it

Get step-by-step solutions from verified subject matter experts