

Question: The probability density function (pdf) for a 2-dimensional real-valued random vector X is as follows: p(x)=P(L=0)p(xL=0)+P(L=1)p(xL=1). Here L is the true class label that indicates
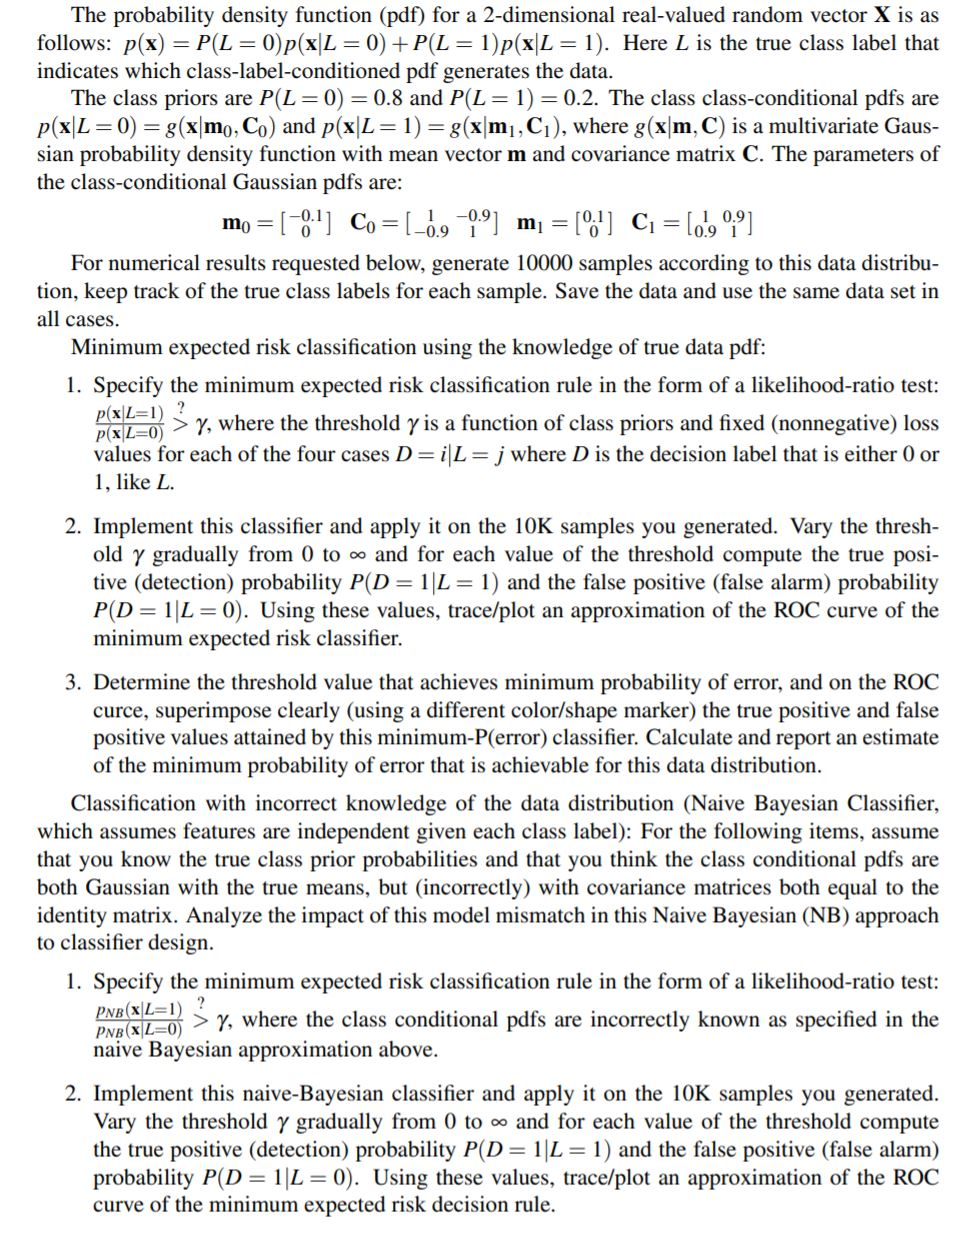
The probability density function (pdf) for a 2-dimensional real-valued random vector X is as follows: p(x)=P(L=0)p(xL=0)+P(L=1)p(xL=1). Here L is the true class label that indicates which class-label-conditioned pdf generates the data. The class priors are P(L=0)=0.8 and P(L=1)=0.2. The class class-conditional pdfs are p(xL=0)=g(xm0,C0) and p(xL=1)=g(xm1,C1), where g(xm,C) is a multivariate Gaussian probability density function with mean vector m and covariance matrix C. The parameters of the class-conditional Gaussian pdfs are: m0=[0.10]C0=[10.90.91]m1=[0.10]C1=[10.90.91] For numerical results requested below, generate 10000 samples according to this data distribution, keep track of the true class labels for each sample. Save the data and use the same data set in all cases. Minimum expected risk classification using the knowledge of true data pdf: 1. Specify the minimum expected risk classification rule in the form of a likelihood-ratio test: p(xL=0)p(xL=1)>?, where the threshold is a function of class priors and fixed (nonnegative) loss values for each of the four cases D=iL=j where D is the decision label that is either 0 or 1 , like L. 2. Implement this classifier and apply it on the 10K samples you generated. Vary the threshold gradually from 0 to and for each value of the threshold compute the true positive (detection) probability P(D=1L=1) and the false positive (false alarm) probability P(D=1L=0). Using these values, trace/plot an approximation of the ROC curve of the minimum expected risk classifier. 3. Determine the threshold value that achieves minimum probability of error, and on the ROC curce, superimpose clearly (using a different color/shape marker) the true positive and false positive values attained by this minimum-P(error) classifier. Calculate and report an estimate of the minimum probability of error that is achievable for this data distribution. Classification with incorrect knowledge of the data distribution (Naive Bayesian Classifier, which assumes features are independent given each class label): For the following items, assume that you know the true class prior probabilities and that you think the class conditional pdfs are both Gaussian with the true means, but (incorrectly) with covariance matrices both equal to the identity matrix. Analyze the impact of this model mismatch in this Naive Bayesian (NB) approach to classifier design. 1. Specify the minimum expected risk classification rule in the form of a likelihood-ratio test: pNB(xL=0)pNB(xL=1)>?, where the class conditional pdfs are incorrectly known as specified in the naive Bayesian approximation above. 2. Implement this naive-Bayesian classifier and apply it on the 10K samples you generated. Vary the threshold gradually from 0 to and for each value of the threshold compute the true positive (detection) probability P(D=1L=1) and the false positive (false alarm) probability P(D=1L=0). Using these values, trace/plot an approximation of the ROC curve of the minimum expected risk decision rule
Step by Step Solution
There are 3 Steps involved in it

Get step-by-step solutions from verified subject matter experts