

Question: The probability density function ( PDF ) of the annual maximum flow for two watersheds is shown in the figure below. Using the information in
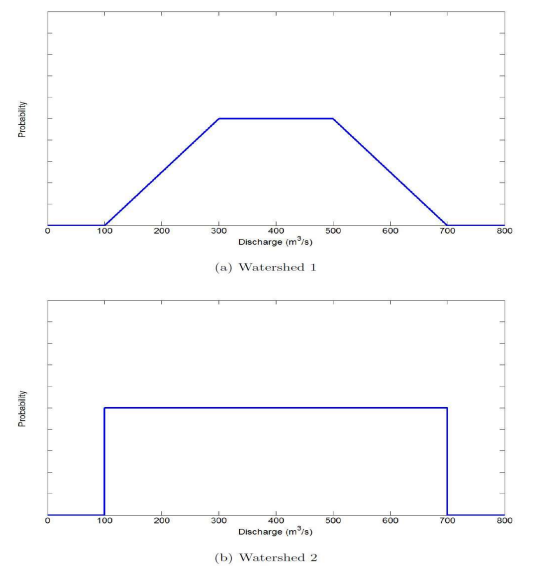
The probability density function PDF of the annual maximum flow for two watersheds is shown in the figure below. Using the information in the figure, find the following probabilities: Probabilities: ms ms ms ms A dam is built at the outlet of each watershed. The spillway of the watershed dam has a maximum capacity of ms The spillway of the watershed dam has a maximum capacity of ms Reliability and risk: calculate the reliability and risk for each dam. Overflow probabilities: Probability of having dam failures over a period of years for the basin side Probability of having a maximum of dam overflow over a period of years for watershed a Watershed
b Watershed
Step by Step Solution
There are 3 Steps involved in it
1 Expert Approved Answer
Step: 1 Unlock

Question Has Been Solved by an Expert!
Get step-by-step solutions from verified subject matter experts
Step: 2 Unlock
Step: 3 Unlock