

Question: The problem comes from a real but simplified case. An English company owns two plants, one in Liverpool and one in Brighton. In addition, it
The problem comes from a real but simplified case. An English company owns two plants, one in Liverpool and one in Brighton. In addition, it has four depots in Newcastle, Birmingham, London and Exeter. The company sells its product to six C1 to C6 customers. These customers can be delivered by depots or directly by factories. The distribution costs incurred by the company are given in euros per ton delivered in Table 1.
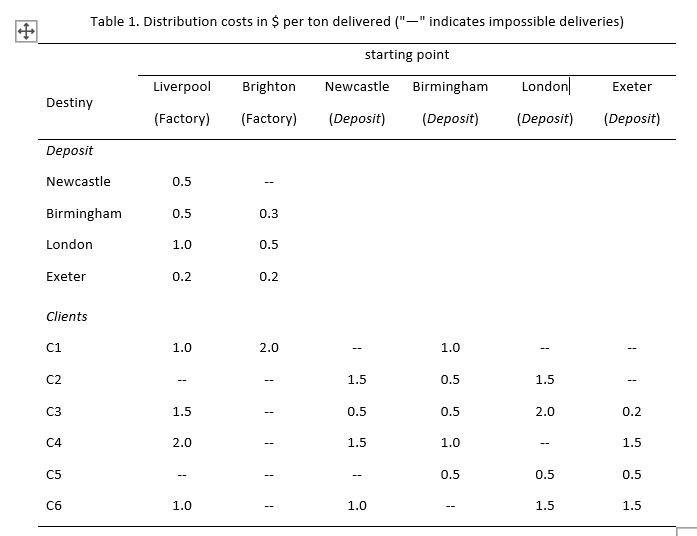
Each factory has a monthly production capacity that cannot be exceeded: Liverpool is limited to 150,000 tonnes and Brighton to 200,000 tonnes. Each depot has a limited monthly flow: 70,000 tonnes for Newcastle, 50,000 tonnes for Birmingham, 100,000 tonnes for London and 40,000 tonnes for Exeter. Each customer has a monthly request that must be met. For C1 to C6 customers, the respective requirements are 50,000, 10,000, 40,000, 35,000, 60,000 and 20,000 tonnes.
a) Propose a generic linear program to achieve a minimum total cost distribution plan. Then solve this model with Excel. To see the structure better, we can draw the network with three vertical layers of nodes, from left to right: factories, warehouses and customers. The model and its translation into Excel are clearer and have fewer variables if you break down the table above into three: one for plant to depot flows, one for customer depot flows, and one for direct plant to customer deliveries. One of the ways to manage impossible connections is to put them at a much higher cost than the real costs: as the solver will minimize the total cost, it will not use these links.
The company wants to change its network. It can open new deposits in Bristol and Northampton and expand the Birmingham depot, but without having more than four deposits in total. If necessary, Newcastle and Exeter can be closed. The additional monthly costs for new deposits and to expand Birmingham are in Table 2, with potential monthly debits.
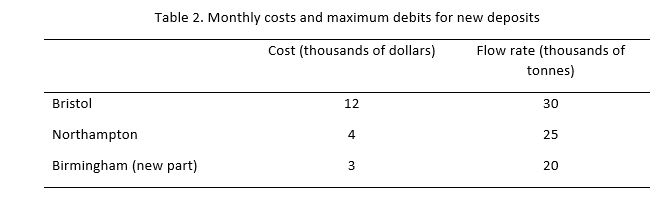
The monthly savings are 10,000 dollar if Newcastle is closed, and 5,000 dollar for Exeter. Distribution costs for new deposits are given in Table 3 (euro per tonne delivered). Costs between plants and customers do not change.
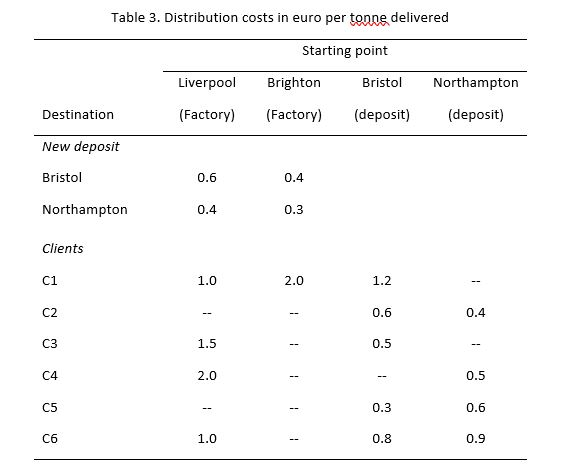
b)Make a single linear model to answer the following questions and solve it with Excel. What new repositories should be opened? Should Birmingham be expanded? Should Exeter and/or Newcastle be closed? What are the new flows to minimize the total cost? Indication: a binary variable must be defined for each type of decision.
Table 1. Distribution costs in $ per ton delivered ("-"indicates impossible deliveries) Liverpool (Factory) Destiny starting point Newcastle Birmingham (Deposit) (Deposit) Brighton (Factory) London (Deposit) Exeter (Deposit) Deposit Newcastle Birmingham London Exeter Clients Table 2. Monthly costs and maximum debits for new deposits Cost (thousands of dollars) Flow rate (thousands of tonnes) Bristol Northampton Birmingham (new part) Table 3. Distribution costs in euro per toppe delivered Starting point Liverpool (Factory) Brighton (Factory) Bristol (deposit) Northampton (deposit) Destination New deposit Bristol Northampton ClientsStep by Step Solution
There are 3 Steps involved in it

Get step-by-step solutions from verified subject matter experts