

Question: The problem involves a silicon wafer with a 0.1 x 2 square micrometer area. The wafer has a phosphorus doping concentration of / . The
The problem involves a silicon wafer with a 0.1 x 2 square micrometer area. The wafer has a phosphorus doping concentration of  /
/ . The basic process conditions are set as follows: the temperature at 1000 degrees Celsius, boron doping at a concentration of
  /
/ Time of 30 minutes, and energy of 70 keV.
I want to analyze the results of simulation graphs depicting the effects of implant energy and boron doping concentration variations on the implantation process.
For simulation, we are asked to analyze the graphs representing the effects of increasing boron doping ( /
/ Vs
Vs  /
/ Vs
Vs  /
/ ) and raising the energy level (40 vs. 70 vs 100 ).
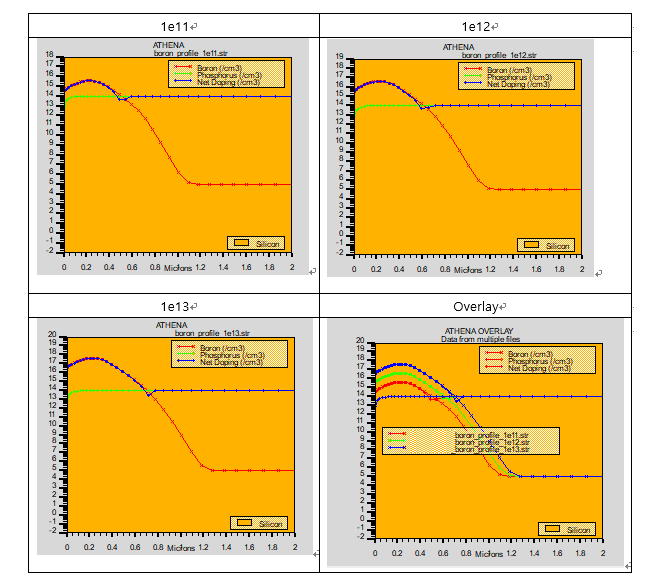
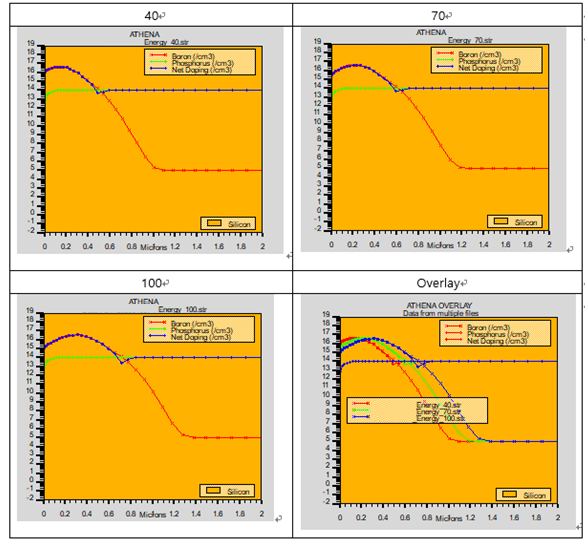
Please explain in detail the differences observed in these graphs and why?
(+ if time and temperature increase, what should we consider and change the graph )
1014 cm3 1012 cm3 1011 cm3 1012 cm3 103 cm3
Step by Step Solution
There are 3 Steps involved in it

Get step-by-step solutions from verified subject matter experts