

Question: The Proctor & Gamble Corporation is usedas an examplefor chapter 8. There are several tables and charts of financial and accounting data. Use the EOY
The Proctor & Gamble Corporation is usedas an examplefor chapter 8. There are several tables and charts of financial and accounting data.
- Use the EOY values based on thoseprojected for 2018(not actual for 2017)
- Assume same number of shares outstanding and a stock price of 91.18
- EPS is calculated as NI/shares
Accomplish these 4 steps
- Calculate the corporate valuation of P&G for 2018 using the 4 evaluation methods. Youmustshow your work to derive the valuation for credit.
- What is the most likely value of the firm and why?
- Comment on the goodwill & intangibles; significance?
- Comment on the treasury stock and effect; significance?
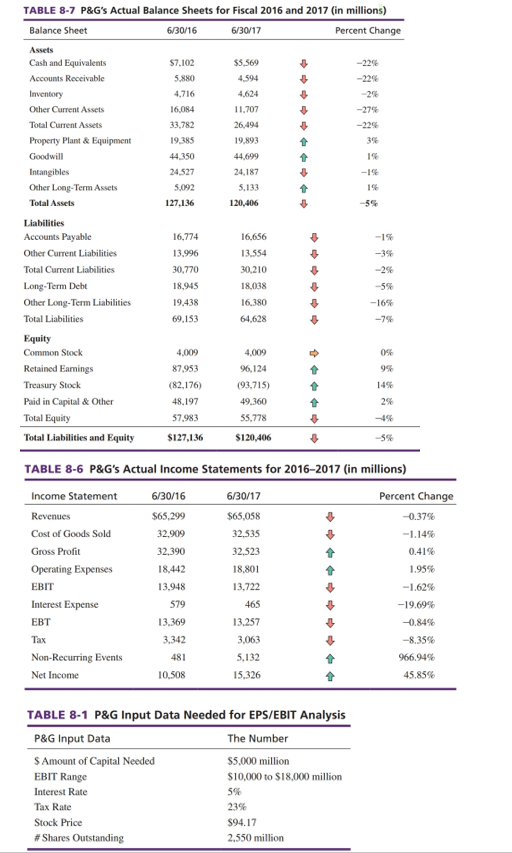
TABLE 8-7 P&G's Actual Balance Sheets for Fiscal 2016 and 2017 (in millions) Balance Sheet 6/30/16 6/30/17 Percent Change Assets Cash and Equivalents $7.102 $5.569 -220 Accounts Receivable 5.880 4,594 -22% Inventory 4.716 4.624 Other Current Assets 16.084 11.707 -27% Total Current Assets 33.782 26.494 -22% Property Plant & Equipment 19.385 19.893 3% Goodwill 44.350 44.699 Intangibles 24 527 24,187 Other Long-Term Assets 5.092 5.133 Total Assets 127,136 120,406 Liabilities Accounts Payable 16.774 16.656 -15 Other Current Liabilities 13.996 13.554 -3% Total Current Liabilities 30,770 30.210 -2% Long-Term Debt 18.945 18.038 -5% Other Long-Term Liabilities 19.438 16.380 -16% Total Liabilities 69.153 64.628 -7% Equity Common Stock 4,009 4,009 0 Retained Earnings 87.953 96.124 9% Treasury Stock (82,176) (93,715) 14 Paid in Capital & Other 48.197 49.360 2% Total Equity $7.983 55.778 Total Liabilities and Equity $127.136 $120.406 -59% TABLE 8-6 P&G's Actual Income Statements for 2016-2017 (in millions) Income Statement 6/30/16 6/30/17 Percent Change Revenues $65,299 $65,058 -0.37% Cost of Goods Sold 32,909 32.535 -1.14% Gross Profit 32.390 32.523 0.41% Operating Expenses 18.442 18,801 1.95% EBIT 13.948 13,722 -1.626 Interest Expense 579 465 -19.69% EBT 13.369 13.257 -0.84% Tax 3.342 3.063 -8.35% Non-Recurring Events 481 5.132 966.94% Net Income 10.508 15.326 45.85% TABLE 8-1 P&G Input Data Needed for EPS/EBIT Analysis P&G Input Data The Number $ Amount of Capital Needed $5,000 million EBIT Range $10,000 to $18,000 million Interest Rate 5% Tax Rate Stock Price $94.17 # Shares Outstanding 2,550 million
Step by Step Solution
There are 3 Steps involved in it

Get step-by-step solutions from verified subject matter experts