

Question: the production process. Click the icon to view the sample data. Data Table Click the icon to view the table of factors for calculating three-sigma
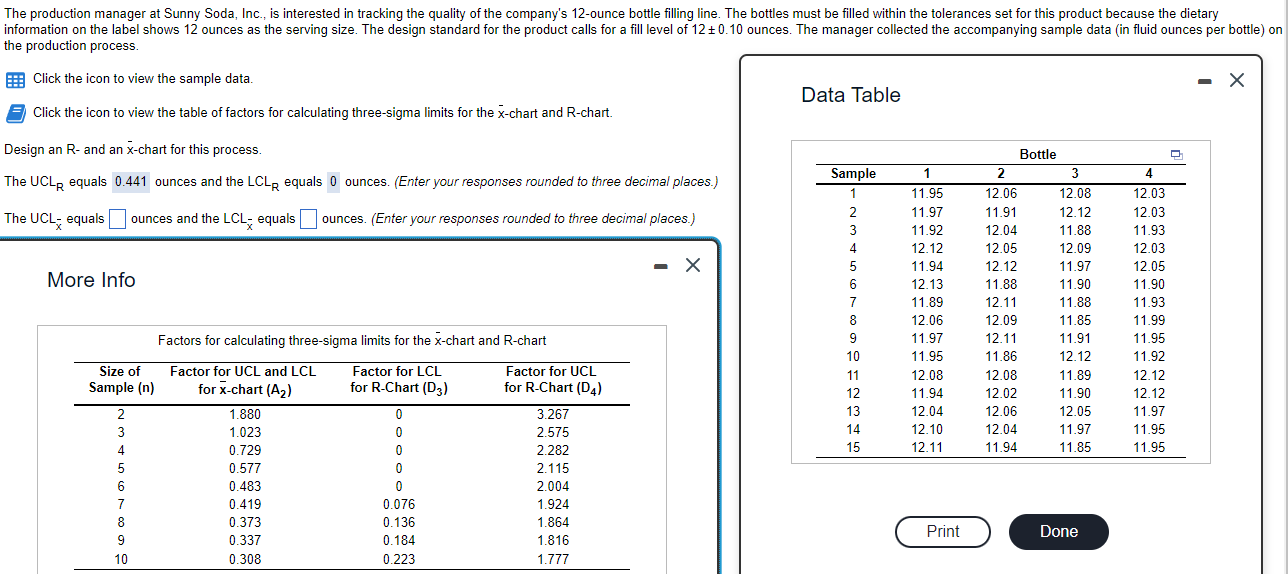
the production process. Click the icon to view the sample data. Data Table Click the icon to view the table of factors for calculating three-sigma limits for the x-chart and R-chart. Design an R - and an x-chart for this process. The UCLR equals ounces and the LCLR equals 0 ounces. (Enter your responses rounded to three decimal places.) The UCequals ounces and the LCL- equals ounces. (Enter your responses rounded to three decimal places.) More Info
Step by Step Solution
There are 3 Steps involved in it
1 Expert Approved Answer
Step: 1 Unlock

Question Has Been Solved by an Expert!
Get step-by-step solutions from verified subject matter experts
Step: 2 Unlock
Step: 3 Unlock