

Question: The professor doesn't offer help and I'm not getting any take aways from the book so I'm completely lost. I have no intention of submitting
The professor doesn't offer help and I'm not getting any take aways from the book so I'm completely lost. I have no intention of submitting someone else work as my own I just need to know the steps to take to solve the problem.
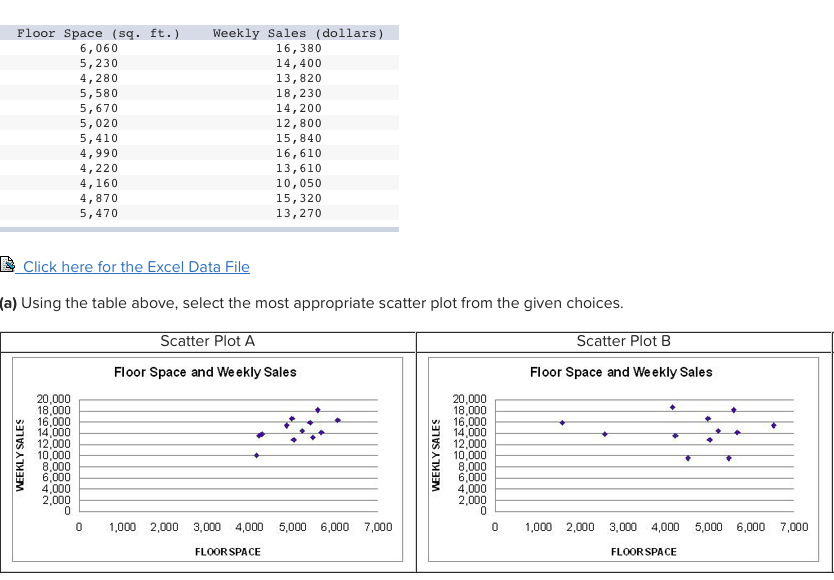
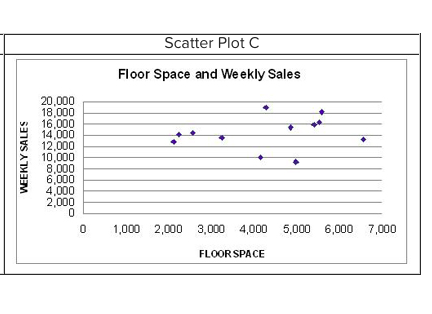
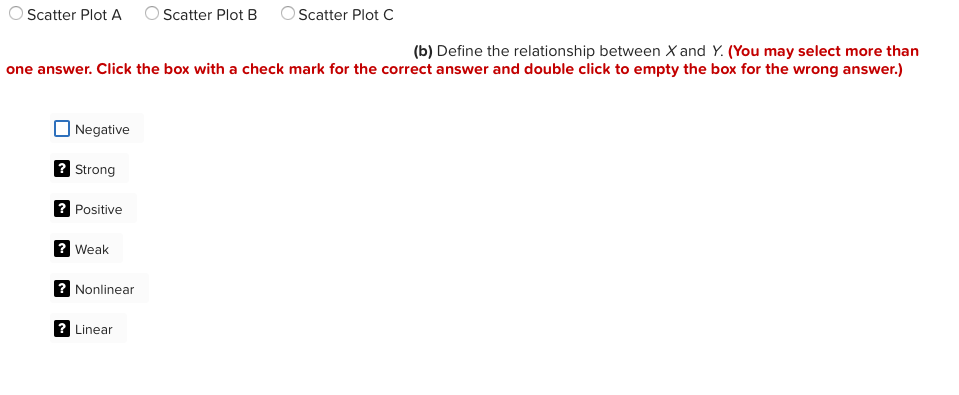
FLOOR SPACE 159 . Et . ! WEEKLY Sales ( dollars ! 6 , 060 16 , 3 80 5 , 230 14 , 400 4 , 280 13 , $20 5 , 5 80 18 , 230 5 , 670 14 , 200 5, 020 12 , BOD 5 , 410 15 , $40 4 , 390 16 , 610 4 , 220 13 , 610 4 , 160 10 , 050 4 , $70 15 , 320 5 , 470 13 , 270 & Click here for the Excel Data File ( a ) Using the table above , select the most appropriate scatter plot from the given choices* Scatter Plot A Scatter Plot B Floor Space and Weekly Sales Floor Space and Weekly Sales 16, 001 14, 001 12,QQQ WEEKLY' SALES { ]TV'S A THITH 4. 509 4. 500 2, 001 1, 0 00 2, 000 3,009 4, 000 5,000 6, 000 7,000 1 , 0 00 2, 000 3,000 4,000 5, QOD 6,000 7,000 FLOORSPACE FLOWORSPACEScatter Plot [ Floor Space and Weekly Sales 1, 20 0 2,000 3,009 4,000 GOOD 6,QQ0 7,OOD FLOWOR SPACEO Scatter Plot A Scatter Plot B* Scatter Plot C ( b ) Define the relationship between * and Y. ( You may select more than one answer . Click the box with a check mark for the correct answer and double click to empty the box for the wrong answer . ) Negative ` Strong {\\ Positive ` Weak {\\ Nonlinear {\\ Linear
Step by Step Solution
There are 3 Steps involved in it

Get step-by-step solutions from verified subject matter experts