

Question: The professor doesn't offer help and I'm not getting any take aways from the book so I'm completely lost. I have no intention of submitting
The professor doesn't offer help and I'm not getting any take aways from the book so I'm completely lost. I have no intention of submitting someone else work as my own I just need to know the steps to take to solve the problem.
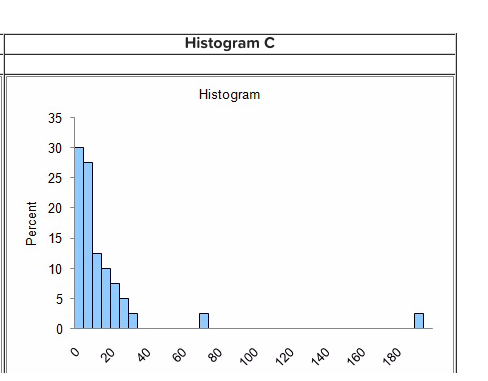
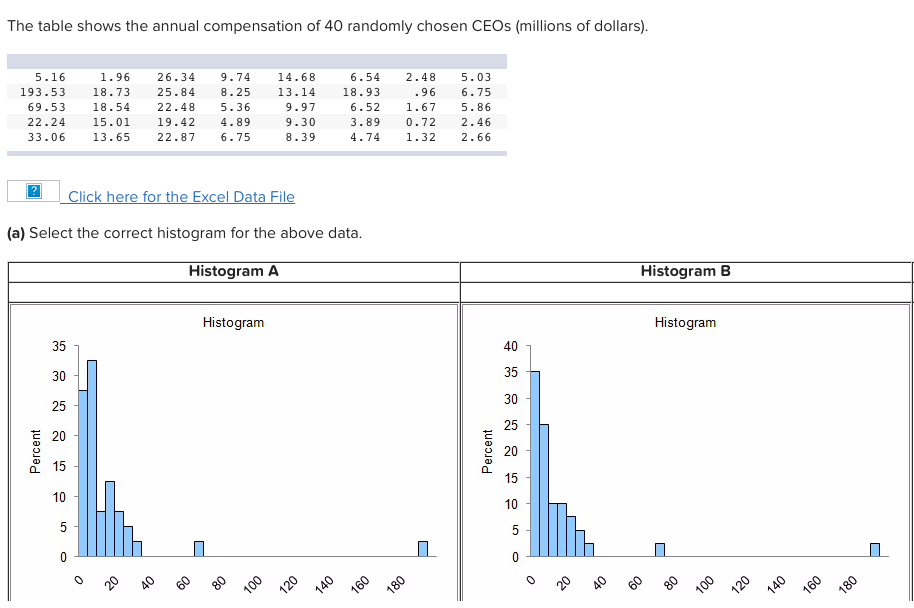
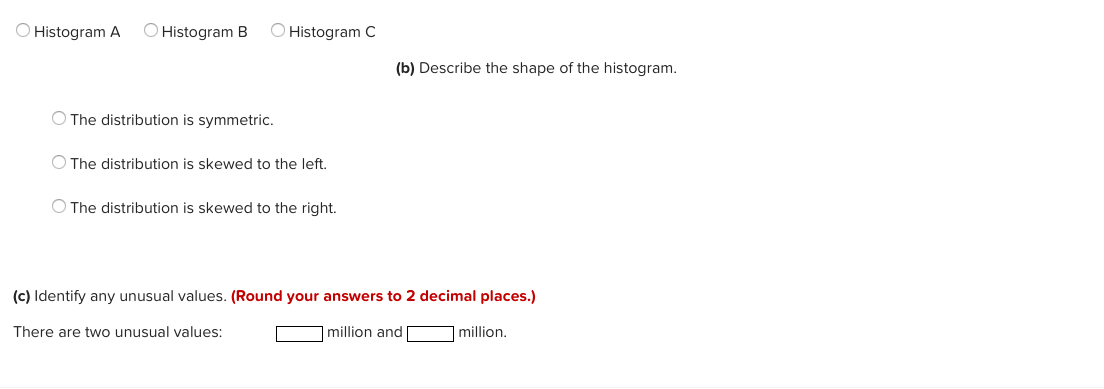
\fThe table shows the annual compensation of 40 randome chosen CEOs {millions of dollars]. 5.16 1.96 26.34 9.24 14.63 6.54 2.45 5.03 193.53 15.?3 25.34 3.25 13.14 15.93 .96 6.?5 69.53 15.54 22.43 5.36 9.9]' 6.52 1.6? 5.36 22-24 15.01 19.42 4.59 9.39 3.39 0.?2 2.46 33.06 13.65 22_37 6.?5 3.39 4.?4 1.32 2.66 Click here for the Excel Data File {a} Select the correct histogram for the above data. Histogram A Histogram B Histogram Histogram o I I $9>9499$ I I \"'P$@@v5' '0 Histogram A 0 Histogram B (3' Histogram C {b} Describe the shape of the histogram. '3' The distribution is symmetric. O The distribution is skewed to the left. '3' The distribution is skewed to the right. {:1 Identify anyr unusual values. {Round your answers to 2 decimal places.) There are two unusual values: million and million
Step by Step Solution
There are 3 Steps involved in it

Get step-by-step solutions from verified subject matter experts