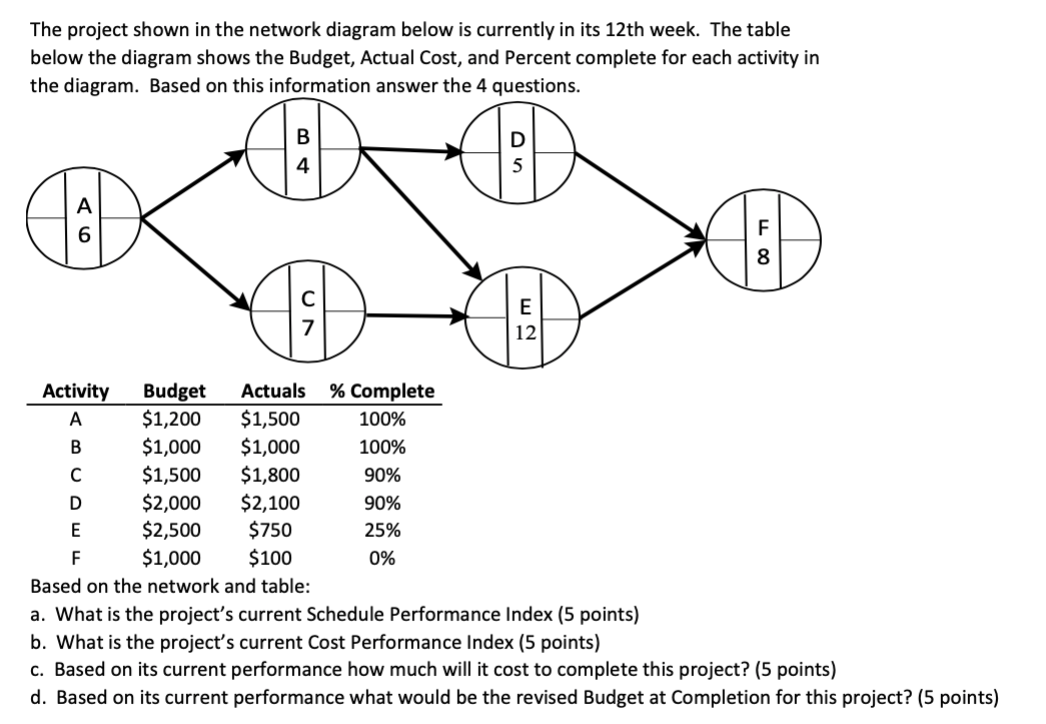
Question: The project shown in the network diagram below is currently in its 12th week. The table below the diagram shows the Budget, Actual Cost, and

The project shown in the network diagram below is

The project shown in the network diagram below is currently in its 12th week. The table below the diagram shows the Budget, Actual Cost, and Percent complete for each activity in the diagram. Based on this information answer the 4 questions. B 4 00 E 12 Activity Budget Actuals % Complete A $1,200 $1,500 100% B $1,000 $1,000 100% $1,500 $1,800 90% D $2,000 $2,100 90% E $2,500 $750 25% F $1,000 $100 0% Based on the network and table: a. What is the project's current Schedule Performance Index (5 points) b. What is the project's current Cost Performance Index (5 points) c. Based on its current performance how much will it cost to complete this project? (5 points) d. Based on its current performance what would be the revised Budget at Completion for this project? (5 points)

Step by Step Solution

There are 3 Steps involved in it

1 Expert Approved Answer
Step: 1 Unlock blur-text-image
Question Has Been Solved by an Expert!

Get step-by-step solutions from verified subject matter experts

Step: 2 Unlock
Step: 3 Unlock

Students Have Also Explored These Related General Management Questions!