

Question: The quarterly sales data (number of copies sold) for a college textbook over the past three years follow. Hint: This data is displayed horizontally. Copy
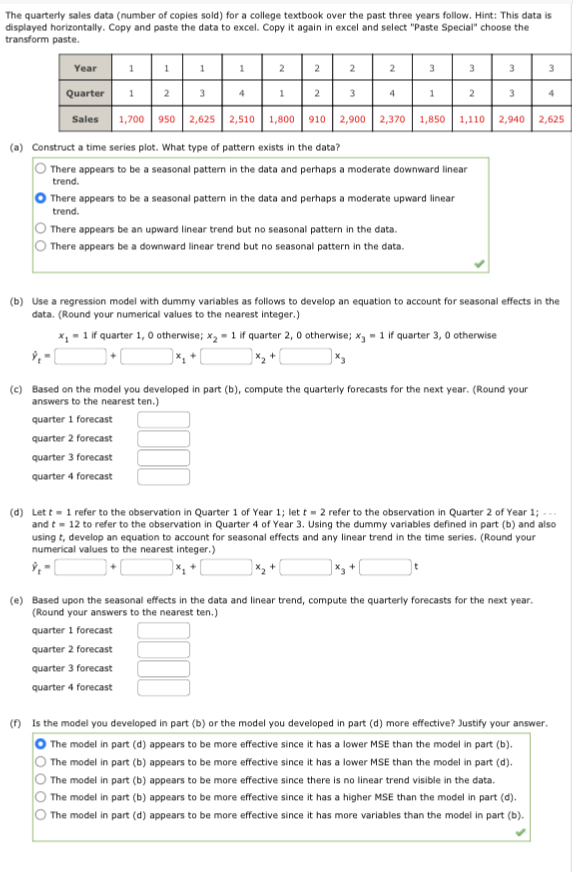
The quarterly sales data (number of copies sold) for a college textbook over the past three years follow. Hint: This data is displayed horizontally. Copy and paste the data to excel. Copy it again in excel and select "Paste Special" choose the transform paste. (a) Construct a time series plot. What type of pattern exists in the data? There appears to be a seasonal pattern in the data and perhaps a moderate downward linear trend. There appears to be a seasonal pattern in the data and perhaps a moderate upward linear trend. There appears be an upward linear trend but no seasonal pattern in the data. There appears be a downward linear trend but no seasonal pattern in the data. (b) Use a regression model with dummy variables as follows to develop an equation to account for seasonal effects in the data. (Round your numerical values to the nearest integer.) x1=1 if quarter 1,0 otherwise; x2=1 if quarter 2,0 otherwise; x3=1 if quarter 3,0 otherwise y^t=+x1+x3+ (c) Based on the model you developed in part (b), compute the quarterly forecasts for the next year. (Round your answers to the nearest ten.) quarter 1 forecast quarter 2 forecast quarter 3 forecast quarter 4 forecast (d) Let t=1 refer to the observation in Quarter 1 of Year 1 ; let t=2 refer to the observation in Quarter 2 of Year 1 ; and t=12 to refer to the observation in Quarter 4 of Year 3. Using the dummy variables defined in part (b) and also using t, develop an equation to account for seasonal effects and any linear trend in the time series. (Round your numerical values to the nearest integer.) y^t=x1+x2+x3+ (e) Based upon the seasonal effects in the data and linear trend, compute the quarterly forecasts for the next year. (Round your answers to the nearest ten.) quarter 1 forecast quarter 2 forecast quarter 3 forecast quarter 4 forecast (f) Is the model you developed in part (b) or the model you developed in part (d) more effective? Justify your answer. The model in part (d) appears to be more effective since it has a lower MSE than the model in part (b). The model in part (b) appears to be more effective since it has a lower MSE than the model in part (d). The model in part (b) appears to be more effective since there is no linear trend visible in the data. The model in part (b) appears to be more effective since it has a higher MSE than the model in part (d). The model in part (d) appears to be more effective since it has more variables than the model in part (b)
Step by Step Solution
There are 3 Steps involved in it

Get step-by-step solutions from verified subject matter experts