

Question: The question I need an answer to is in the image attached. 2. Price controls in the Florida orange market The following graph shows the
The question I need an answer to is in the image attached.
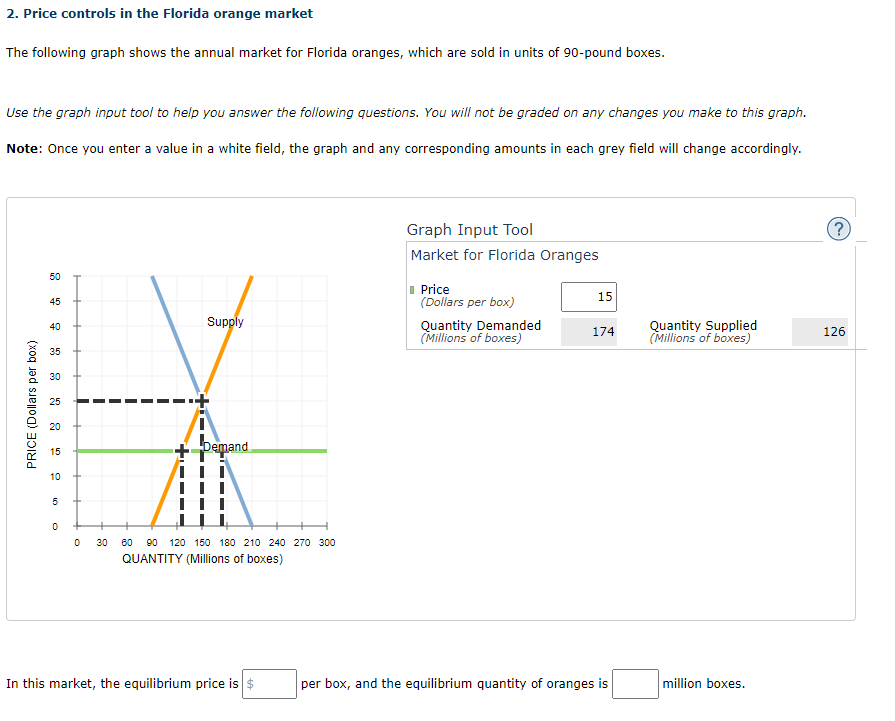
2. Price controls in the Florida orange market The following graph shows the annual market for Florida oranges, which are sold in units of 90-pound boxes. Use the graph input tool to help you answer the following questions. You will not be graded on any changes you make to this graph. Note: Once you enter a value in a white field, the graph and any corresponding amounts in each grey field will change accordingly. Graph Input Tool Market for Florida Oranges 50 Price 45 ( Dollars per box) 15 Supply Quantity Demanded 174 Quantity Supplied PRICE (Dollars per box) (Millions of boxes) (Millions of boxes) 126 35 30 20 Demand 0 30 60 90 120 150 180 210 240 270 300 QUANTITY (Millions of boxes) In this market, the equilibrium price is $ per box, and the equilibrium quantity of oranges is million boxes
Step by Step Solution
There are 3 Steps involved in it

Get step-by-step solutions from verified subject matter experts