

Question: The question is in the image Part B: Short Answer Questions The following figure represents a market for apples. Price X Quantity In this figure
The question is in the image
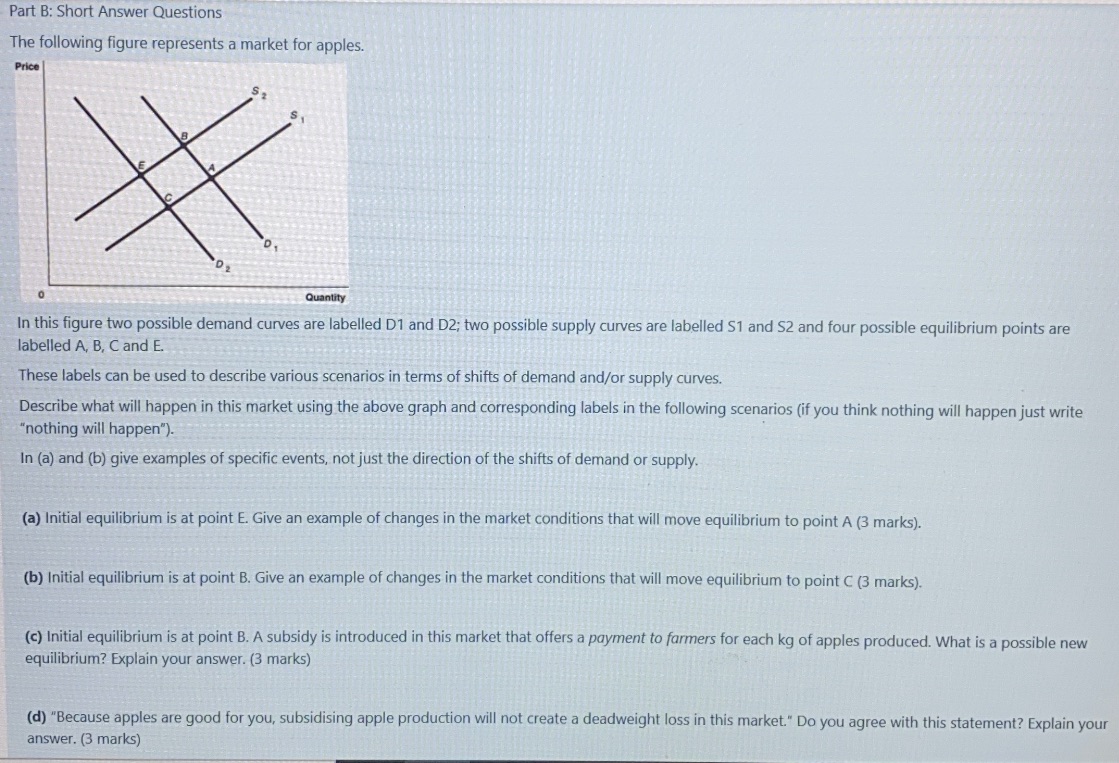
Part B: Short Answer Questions The following figure represents a market for apples. Price X Quantity In this figure two possible demand curves are labelled D1 and D2; two possible supply curves are labelled $1 and $2 and four possible equilibrium points are labelled A, B, C and E. These labels can be used to describe various scenarios in terms of shifts of demand and/or supply curves. Describe what will happen in this market using the above graph and corresponding labels in the following scenarios (if you think nothing will happen just write "nothing will happen"). In (a) and (b) give examples of specific events, not just the direction of the shifts of demand or supply. (a) Initial equilibrium is at point E. Give an example of changes in the market conditions that will move equilibrium to point A (3 marks). (b) Initial equilibrium is at point B. Give an example of changes in the market conditions that will move equilibrium to point C (3 marks). (c) Initial equilibrium is at point B. A subsidy is introduced in this market that offers a payment to farmers for each kg of apples produced. What is a possible new equilibrium? Explain your answer. (3 marks) (d) "Because apples are good for you, subsidising apple production will not create a deadweight loss in this market." Do you agree with this statement? Explain your
Step by Step Solution
There are 3 Steps involved in it

Get step-by-step solutions from verified subject matter experts