

Question: The question is the screenshot. 4. Inferences about the difference between two population proportions Most major survey research organizations do not include wireless telephone numbers
The question is the screenshot.
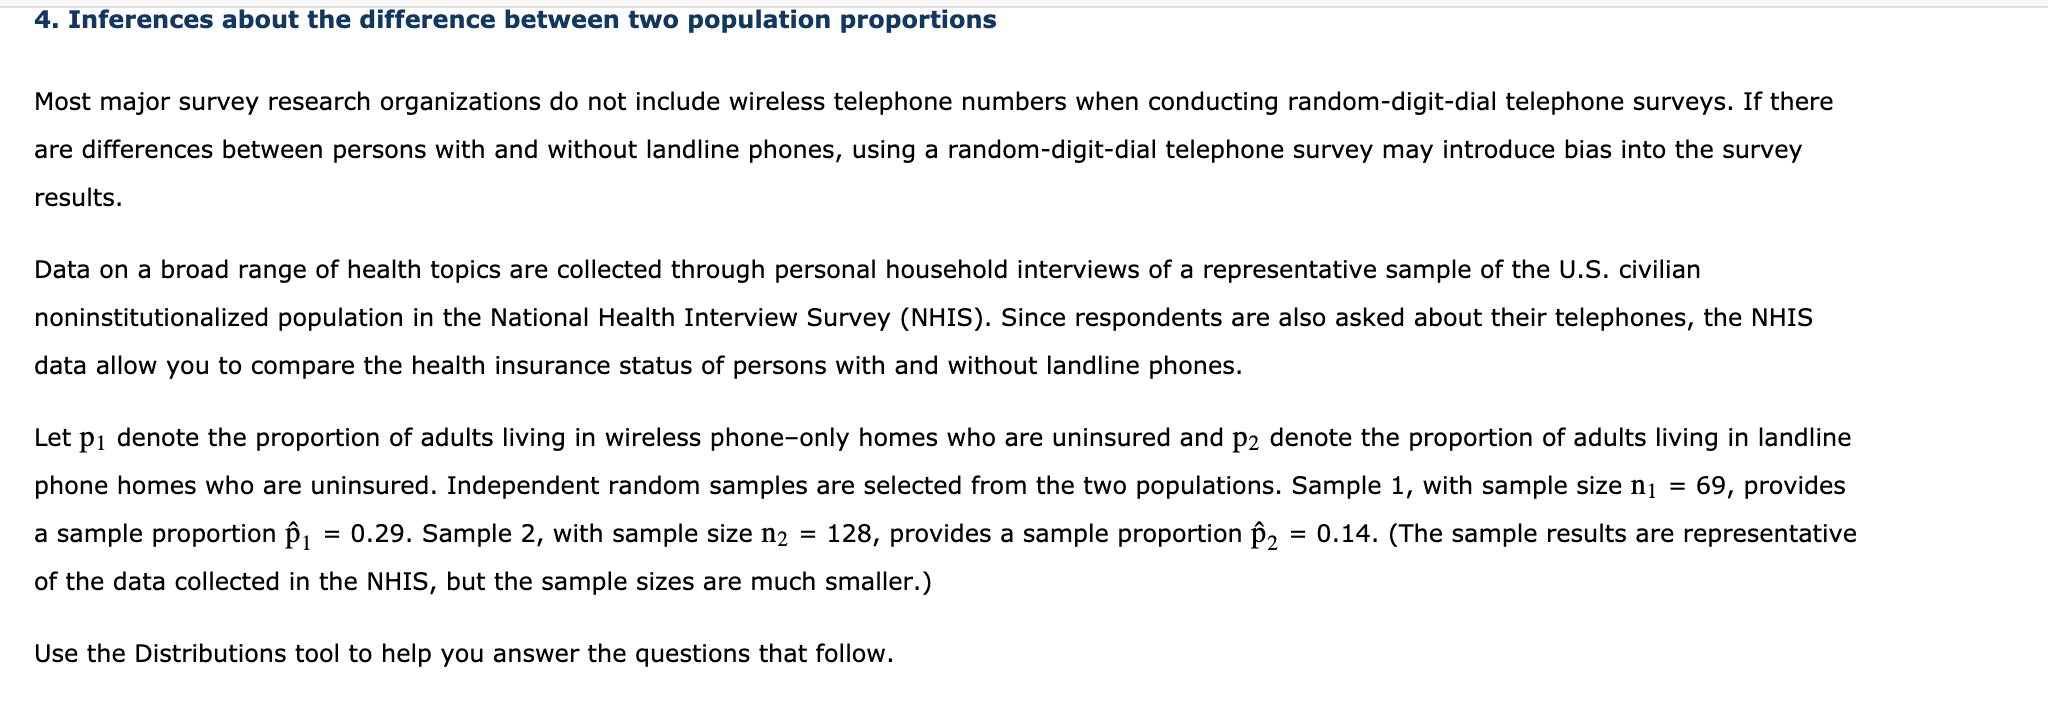
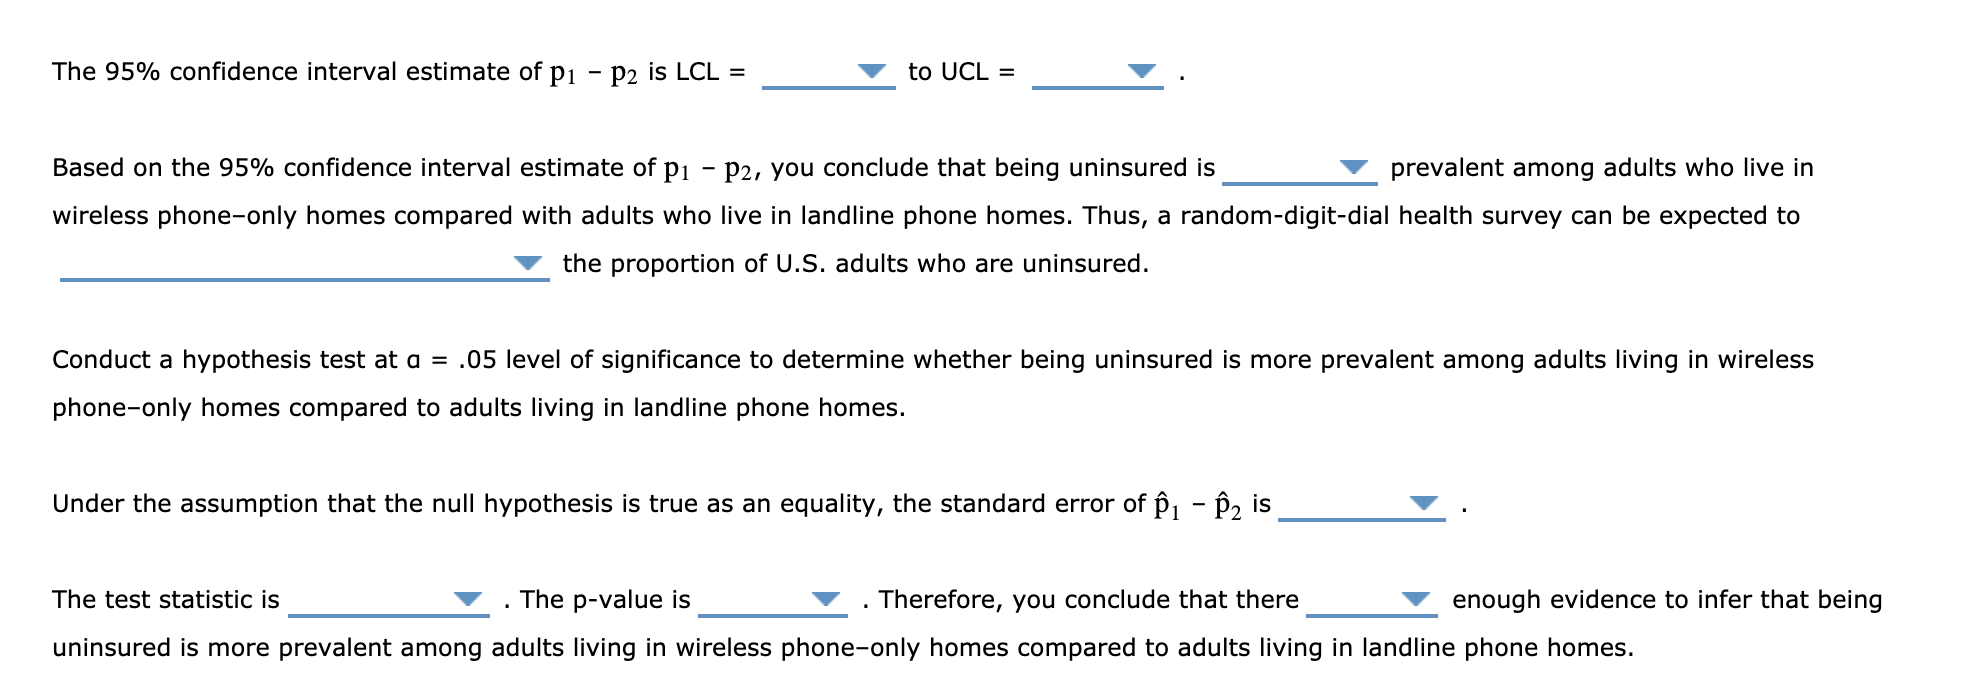
4. Inferences about the difference between two population proportions Most major survey research organizations do not include wireless telephone numbers when conducting random-digit-dial telephone surveys. If there are differences between persons with and without landline phones, using a random-digitdial telephone survey may introduce bias into the survey results. Data on a broad range of health topics are collected through personal household interviews of a representative sample of the us. civilian noninstitutionalized population in the National Health Interview Survey (NHIS). Since respondents are also asked about their telephones, the NHIS data allow you to compare the health insurance status of persons with and without landline phones. Let p1 denote the proportion of adults living in wireless phoneonly homes who are uninsured and p2 denote the proportion of adults living in landline phone homes who are uninsured. Independent random samples are selected from the two populations. Sample 1, with sample size m = 69, provides a sample proportion 131 = 0.29. Sample 2, with sample size n2 = 128, provides a sample proportion [32 = 0.14. (The sample results are representative of the data collected in the NHIS, but the sample sizes are much smaller.) Use the Distributions tool to help you answer the questions that follow. \fThe 95% confidence interval estimate of p1 - p2 is LCL = V to UCL = V . Based on the 95% confidence interval estimate of p1 p2, you conclude that being uninsured is V prevalent among adults who live in wireless phoneonly homes compared with adults who live in landline phone homes. Thus, a random-digit-dial health survey can be expected to V the proportion of U.S. adults who are uninsured. Conduct a hypothesis test at o = .05 level of signicance to determine whether being uninsured is more prevalent among adults living in wireless phone-only homes compared to adults living in landline phone homes. Under the assumption that the null hypothesis is true as an equality, the standard error of 131 - ['52 is V . The test statistic is V . The p-value is V . Therefore, you conclude that there V enough evidence to infer that being uninsured is more prevalent among adults living in wireless phoneonly homes compared to adults living in landline phone homes
Step by Step Solution
There are 3 Steps involved in it

Get step-by-step solutions from verified subject matter experts